7) Consider the following null and alternative hypothesis. Ho : u=120 versus H1 : p> 120 A random sample of 81 observations taken from this population produced a sample mean of 123.5 and a sample standard deviation of 15. If this test is made at the 2.5% significance level, would you reject the null hypothesis?
7) Consider the following null and alternative hypothesis. Ho : u=120 versus H1 : p> 120 A random sample of 81 observations taken from this population produced a sample mean of 123.5 and a sample standard deviation of 15. If this test is made at the 2.5% significance level, would you reject the null hypothesis?

MATLAB: An Introduction with Applications
6th Edition
ISBN:9781119256830
Author:Amos Gilat
Publisher:Amos Gilat
Chapter1: Starting With Matlab
Section: Chapter Questions
Problem 1P

Related questions
Question
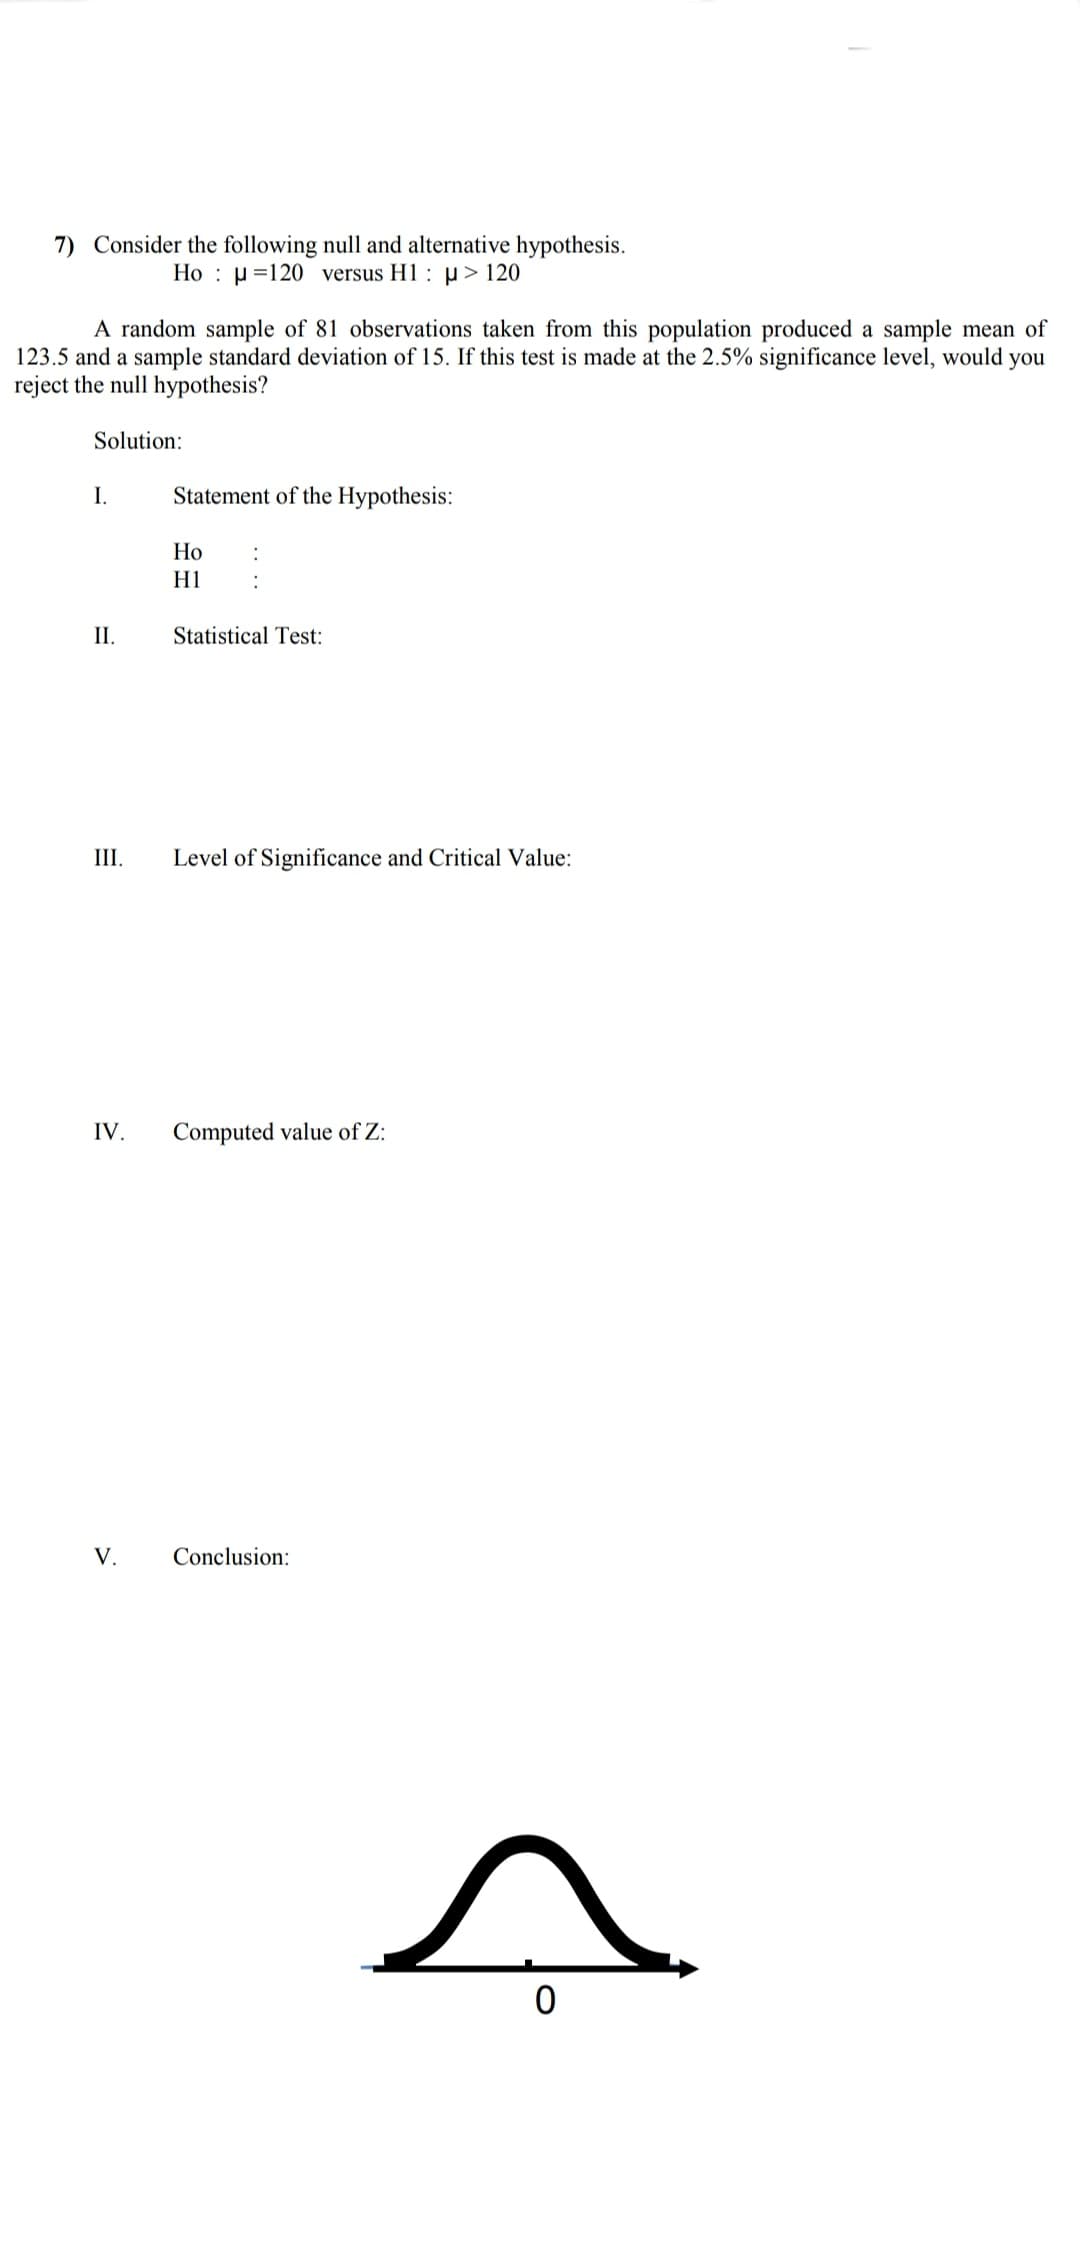
Transcribed Image Text:7) Consider the following null and alternative hypothesis.
Ho : µ=120 versus H1: p> 120
A random sample of 81 observations taken from this population produced a sample mean of
123.5 and a sample standard deviation of 15. If this test is made at the 2.5% significance level, would you
reject the null hypothesis?
Solution:
I.
Statement of the Hypothesis:
Но
H1
II.
Statistical Test:
III.
Level of Significance and Critical Value:
IV.
Computed value of Z:
V.
Conclusion:
Expert Solution
This question has been solved!
Explore an expertly crafted, step-by-step solution for a thorough understanding of key concepts.

This is a popular solution!

Trending now
This is a popular solution!

Step by step
Solved in 4 steps with 3 images

Recommended textbooks for you
MATLAB: An Introduction with Applications
Statistics
ISBN:
9781119256830
Author:
Amos Gilat
Publisher:
John Wiley & Sons Inc

Probability and Statistics for Engineering and th…
Statistics
ISBN:
9781305251809
Author:
Jay L. Devore
Publisher:
Cengage Learning

Statistics for The Behavioral Sciences (MindTap C…
Statistics
ISBN:
9781305504912
Author:
Frederick J Gravetter, Larry B. Wallnau
Publisher:
Cengage Learning
MATLAB: An Introduction with Applications
Statistics
ISBN:
9781119256830
Author:
Amos Gilat
Publisher:
John Wiley & Sons Inc
Probability and Statistics for Engineering and th…
Statistics
ISBN:
9781305251809
Author:
Jay L. Devore
Publisher:
Cengage Learning
Statistics for The Behavioral Sciences (MindTap C…
Statistics
ISBN:
9781305504912
Author:
Frederick J Gravetter, Larry B. Wallnau
Publisher:
Cengage Learning

Elementary Statistics: Picturing the World (7th E…
Statistics
ISBN:
9780134683416
Author:
Ron Larson, Betsy Farber
Publisher:
PEARSON

The Basic Practice of Statistics
Statistics
ISBN:
9781319042578
Author:
David S. Moore, William I. Notz, Michael A. Fligner
Publisher:
W. H. Freeman

Introduction to the Practice of Statistics
Statistics
ISBN:
9781319013387
Author:
David S. Moore, George P. McCabe, Bruce A. Craig
Publisher:
W. H. Freeman