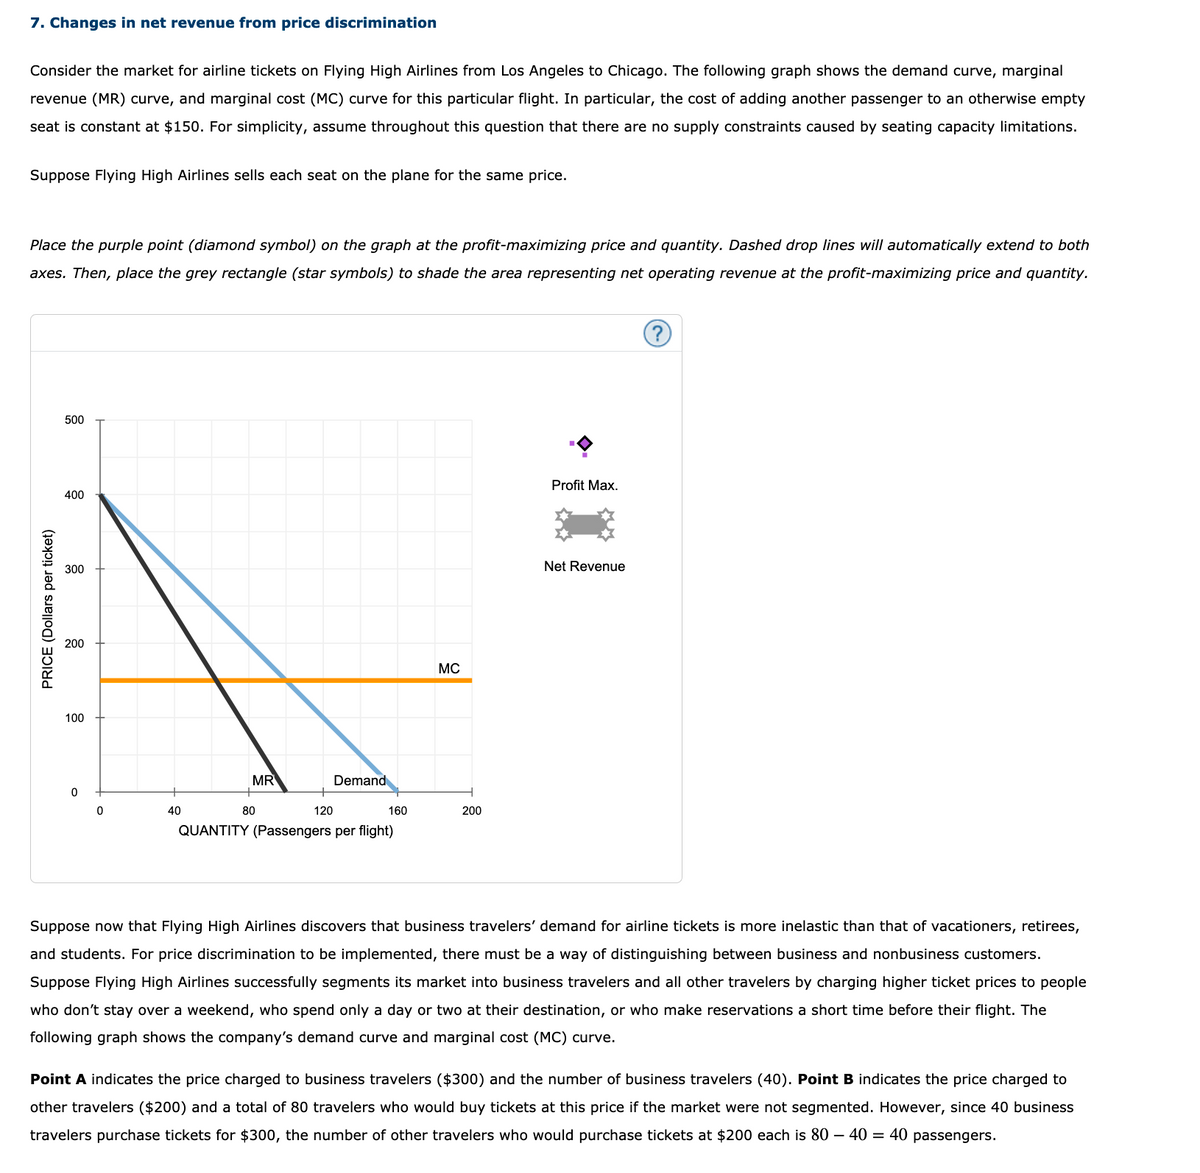
7. Changes in net revenue from price discrimination Consider the market for airline tickets on Flying High Airlines from Los Angeles to Chicago. The following graph shows the demand curve, marginal revenue (MR) curve, and marginal cost (MC) curve for this particular flight. In particular, the cost of adding another passenger to an otherwise empty seat is constant at $150. For simplicity, assume throughout this question that there are no supply constraints caused by seating capacity limitations. Suppose Flying High Airlines sells each seat on the plane for the same price. Place the purple point (diamond symbol) on the graph at the profit-maximizing price and quantity. Dashed drop lines will automatically extend to both axes. Then, place the grey rectangle (star symbols) to shade the area representing net operating revenue at the profit-maximizing price and quantity. 500 Profit Max. 400 300 Net Revenue 200 MC 100 MR Demand 40 80 120 160 200 QUANTITY (Passengers per flight) PRICE (Dollars per ticket)
7. Changes in net revenue from price discrimination Consider the market for airline tickets on Flying High Airlines from Los Angeles to Chicago. The following graph shows the demand curve, marginal revenue (MR) curve, and marginal cost (MC) curve for this particular flight. In particular, the cost of adding another passenger to an otherwise empty seat is constant at $150. For simplicity, assume throughout this question that there are no supply constraints caused by seating capacity limitations. Suppose Flying High Airlines sells each seat on the plane for the same price. Place the purple point (diamond symbol) on the graph at the profit-maximizing price and quantity. Dashed drop lines will automatically extend to both axes. Then, place the grey rectangle (star symbols) to shade the area representing net operating revenue at the profit-maximizing price and quantity. 500 Profit Max. 400 300 Net Revenue 200 MC 100 MR Demand 40 80 120 160 200 QUANTITY (Passengers per flight) PRICE (Dollars per ticket)

Chapter6: Consumer Choice And Demand
Section: Chapter Questions
Problem 3.7P

Related questions
Question
100%
Changes in net revenue from price discrimination
Consider the market for airline tickets on Flying High Airlines from Los Angeles to Chicago. The following graph shows the demand curve, marginal revenue (MR) curve, and marginal cost (MC) curve for this particular flight. In particular, the cost of adding another passenger to an otherwise empty seat is constant at $150. For simplicity, assume throughout this question that there are no supply constraints caused by seating capacity limitations.
Suppose Flying High Airlines sells each seat on the plane for the same price.
Place the purple point (diamond symbol) on the graph at the profit-maximizing price and quantity. Dashed drop lines will automatically extend to both axes. Then, place the grey rectangle (star symbols) to shade the area representing net operating revenue at the profit-maximizing price and quantity.
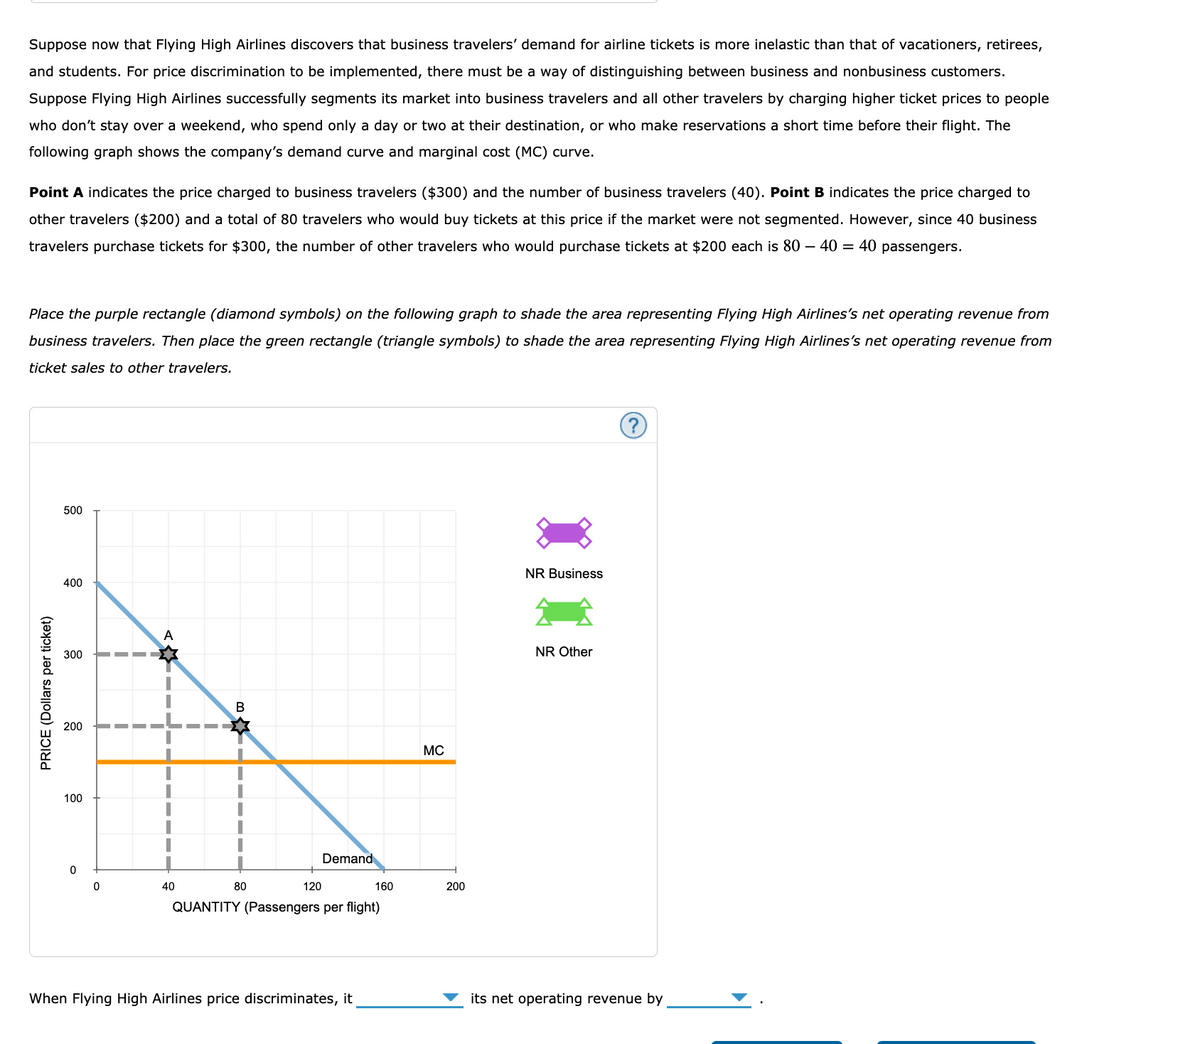
Suppose now that Flying High Airlines discovers that business travelers’ demand for airline tickets is more inelastic than that of vacationers, retirees, and students. For price discrimination to be implemented, there must be a way of distinguishing between business and nonbusiness customers. Suppose Flying High Airlines successfully segments its market into business travelers and all other travelers by charging higher ticket prices to people who don’t stay over a weekend, who spend only a day or two at their destination, or who make reservations a short time before their flight. The following graph shows the company’s demand curve and marginal cost (MC) curve.
Point A indicates the price charged to business travelers ($300) and the number of business travelers (40). Point B indicates the price charged to other travelers ($200) and a total of 80 travelers who would buy tickets at this price if the market were not segmented. However, since 40 business travelers purchase tickets for $300, the number of other travelers who would purchase tickets at $200 each is 80−40=40
passengers.
Place the purple rectangle (diamond symbols) on the following graph to shade the area representing Flying High Airlines’s net operating revenue from business travelers. Then place the green rectangle (triangle symbols) to shade the area representing Flying High Airlines’s net operating revenue from ticket sales to other travelers.
Transcribed Image Text:Suppose now that Flying High Airlines discovers that business travelers' demand for airline tickets is more inelastic than that of vacationers, retirees,
and students. For price discrimination to be implemented, there must be a way of distinguishing between business and nonbusiness customers.
Suppose Flying High Airlines successfully segments its market into business travelers and all other travelers by charging higher ticket prices to people
who don't stay over a weekend, who spend only a day or two at their destination, or who make reservations a short time before their flight. The
following graph shows the company's demand curve and marginal cost (MC) curve.
Point A indicates the price charged to business travelers ($300) and the number of business travelers (40). Point B indicates the price charged to
other travelers ($200) and a total of 80 travelers who would buy tickets at this price if the market were not segmented. However, since 40 business
travelers purchase tickets for $300, the number of other travelers who would purchase tickets at $200 each is 80 – 40 = 40 passengers.
Place the purple rectangle (diamond symbols) on the following graph to shade the area representing Flying High Airlines's net operating revenue from
business travelers. Then place the green rectangle (triangle symbols) to shade the area representing Flying High Airlines's net operating revenue from
ticket sales to other travelers.
500
NR Business
400
A
300
NR Other
В
200
MC
100
Demand
40
80
120
160
200
QUANTITY (Passengers per flight)
When Flying High Airlines price discriminates, it
its net operating revenue by
PRICE (Dollars per ticket)
Transcribed Image Text:7. Changes in net revenue from price discrimination
Consider the market for airline tickets on Flying High Airlines from Los Angeles to Chicago. The following graph shows the demand curve, marginal
revenue (MR) curve, and marginal cost (MC) curve for this particular flight. In particular, the cost of adding another passenger to an otherwise empty
seat is constant at $150. For simplicity, assume throughout this question that there are no supply constraints caused by seating capacity limitations.
Suppose Flying High Airlines sells each seat on the plane for the same price.
Place the purple point (diamond symbol) on the graph at the profit-maximizing price and quantity. Dashed drop lines will automatically extend to both
axes. Then, place the grey rectangle (star symbols) to shade the area representing net operating revenue at the profit-maximizing price and quantity.
500
Profit Max.
400
300
Net Revenue
200
MC
100
MR
Demand
40
80
120
160
200
QUANTITY (Passengers per flight)
Suppose now that Flying High Airlines discovers that business travelers' demand for airline tickets is more inelastic than that of vacationers, retirees,
and students. For price discrimination to be implemented, there must be a way of distinguishing between business and nonbusiness customers.
Suppose Flying High Airlines successfully segments its market into business travelers and all other travelers by charging higher ticket prices to people
who don't stay over a weekend, who spend only a day or two at their destination, or who make reservations a short time before their flight. The
following graph shows the company's demand curve and marginal cost (MC) curve.
Point A indicates the price charged to business travelers ($300) and the number of business travelers (40). Point B indicates the price charged to
other travelers ($200) and a total of 80 travelers who would buy tickets at this price if the market were not segmented. However, since 40 business
travelers purchase tickets for $300, the number of other travelers who would purchase tickets at $200 each is 80 – 40 = 40 passengers.
PRICE (Dollars per ticket)
Expert Solution
This question has been solved!
Explore an expertly crafted, step-by-step solution for a thorough understanding of key concepts.

This is a popular solution!

Trending now
This is a popular solution!

Step by step
Solved in 2 steps with 2 images

Knowledge Booster


Learn more about
Need a deep-dive on the concept behind this application? Look no further. Learn more about this topic, economics and related others by exploring similar questions and additional content below.Recommended textbooks for you


Managerial Economics: Applications, Strategies an…
Economics
ISBN:
9781305506381
Author:
James R. McGuigan, R. Charles Moyer, Frederick H.deB. Harris
Publisher:
Cengage Learning
Managerial Economics: Applications, Strategies an…
Economics
ISBN:
9781305506381
Author:
James R. McGuigan, R. Charles Moyer, Frederick H.deB. Harris
Publisher:
Cengage Learning

Exploring Economics
Economics
ISBN:
9781544336329
Author:
Robert L. Sexton
Publisher:
SAGE Publications, Inc

Principles of Economics 2e
Economics
ISBN:
9781947172364
Author:
Steven A. Greenlaw; David Shapiro
Publisher:
OpenStax