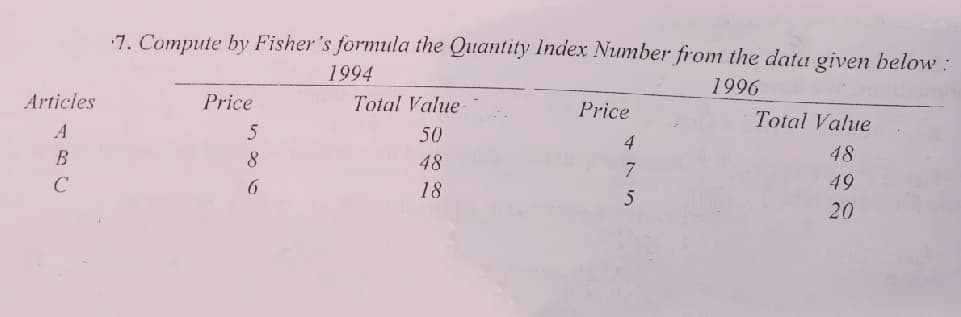
7. Compute by Fisher's formula the Quantity Index Number from the data given below 1994 1996 Articles Price Total Value Price Total Value A 5 50 4 48 B 48 7. 49 18 5 20


Q: A customer is chosen at random. Find the probability that the customer uses the company more than fi...
A:
Q: Class F 3-7 4 8-12 7 13-17 18-22 5 Compute the sample Σ fM mean Ef
A:
Q: If X-B(5,0.6), then P(X 22) is (2
A: Here given, X follows a binomial distribution with n = 5 and p = 0.6
Q: The mean weekly sales of the chocolate bar in candy stores was 1463 bars per store. After an adverti...
A:
Q: The first four central moments of a distribution are 0, 16, -36 and 120 respectively. Comment upon t...
A:
Q: survey claims that 9 out of 10 doctors recommend aspirin for their patients with headaches. To test ...
A:
Q: CASE 6: Yeshua wants to have a sample size of the number of children that he needs for his survey pr...
A: Case 6:
Q: Automobile racing, high-performance driving schools, and driver education programs run by automobile...
A: Please find the step by step solution below. We should find whether the two variables are significan...
Q: Recently, the stock market took big swings up and down. A survey of 969 adult investors asked how of...
A:
Q: A manufacturer of apple phone charges claims that only 4% of his production is defective. In a rando...
A:
Q: Assume that half the population is vegetarian so that the chance of an individual being a vegetarian...
A:
Q: Which statement below is correct? a. Standard deviation should be used when calculating z for a sin...
A:
Q: How many different ways can 5 out of 8 different shirts, 4 out of 10 different pairs of pants, and 3...
A: We have given that, Shirts = 8 , pairs of pants = 10 and pairs of socks = 6
Q: From the following data find out whether there is any significant relationship between gender and p...
A: Given: Preference for color\ Gender Male Female Pink 56 42 Black 67 39 Yellow 34 25
Q: The first of two sub-groups has 10 items with mean 15 and standard deviation 3. If the whole group h...
A:
Q: The following tablė gives the classification of Students accord- ing to sex and examination result. ...
A: Given that Males Females Total Passed 30 40 70 Failed 20 10 30 Total 50 50 100
Q: A) Construct the 95% confidence interval for the difference in means. The means and pooled standard ...
A:
Q: student receives test scores of 62, 83, and 91. The student's term project score is 88 and the homew...
A: Given that X Weight 62 20%=0.20 83 20%=0.20 91 20%=0.20 88 15%=0.15 76 25%=0.25 Tot...
Q: Example 9-32. Show that the mean value of positive square root of a y (u) variate is T(u +;)/T(u). H...
A:
Q: For the null hypothesis Median (n) - 5, compute the values of 7*, T, and T for the following ôbserva...
A:
Q: 1) Levels of Measurement A. What is the Nominal level of measurement? B. What is the Ordinal level o...
A: Note- As per our policy we can answer only the first 3 sub-parts of a question. Please make a new re...
Q: Finally expected loss
A:
Q: (a) A population has a mean of 0.1 and standard deviation of 2.1. Find the probahility that the mean...
A:
Q: Example 19-5. Use the method of separation of symbols to prove the following identities : n +1 n + 1...
A:
Q: Suppose there are three balls in a box. On one of the balls is the number 1, on another is the numbe...
A:
Q: One aspect of the beauty of scenic landscape is its variability. The elevations (feet above sea leve...
A: We have given that data I want to find mean and standard deviation Mean = sum of all observations/...
Q: Class Act Pty has found that 21% of its policy holders are below the age of 30. A sample of 165 cust...
A: Given : Proportion of customers having age below 30 (p) = 0.21 Sample size of customers (n) = 165
Q: In 2003, Major League Baseball took steps to speed up the paly of baseball games and make games a mo...
A:
Q: the probability that a bird will lay an egg is 75%, the probability that the egg will hatch is 50%, ...
A: Given that The probability that bird will lay an egg = 75% ; P(Egg) = 0.75 The probability that e...
Q: A candy company developed a new consumer product that is expected to earn $1,000 in profit each year...
A:
Q: * P(x) -8 0.26 -7 0.1 0.13 2 0.27 5 0.24 Send data to Excel Part 1 of 2 (a) Find the mean. Round the...
A:
Q: Find the value of u, and u, from the following data: Intelligence Scores f 40-44 3 35-39 30-34 25-29...
A:
Q: Question 1 For the following scenarios provide the following: • the null and alternative hypothe...
A: Given statement: a. A meal supplement provider claims that the average difference in calories betwe...
Q: 13.27 Women's heights. A random sample of female college students has a mean height of 65 inches, wh...
A:
Q: The average cost of tuition plus room and board for a small private liberal arts college is reported...
A: We have given that Sample size n =350 Sample mean = 8745 Population standard deviation =1200
Q: The shelf life of a battery produced by one major company is known to be normally distributed, with ...
A: As per guideline expert have to answer first question only.
Q: The three numbers 7,9, 14 have a sum of 30 and therefore a mean of 10. Use software to determine the...
A: The mean for given 3 observations is 10.
Q: In swimming, clearly you would like to swim fast, but swimming consistent times is also important. A...
A: Formula : Test statistic :
Q: 7. A student prepares for an exam by studying a list of ten problems. She can solve six of them. For...
A: Binomial distribution is given by
Q: Three math classes took a quiz, and their scores are displayed in the histograms below. Set A 16 14 ...
A: I want to tell you which one is the correct choice.
Q: The table below shows the color and the model of cars purchased by 160 randomly selected customers a...
A: Given : Claim : color chosen and car model are independent.
Q: The data below are the height of 20 students in a class: 133 136 120 138 134 132 126 141 127 143 130...
A: For the given data Construct Bar graph , Pie graph and Histogram
Q: Chemical Oxygen Demand (COD) is a necessary water fine parameter due to the fact similar to BOD, it ...
A: Introduction: Denote μ1, μ2, μ3 as the true mean reduction percentage of COD in wastewater, using Tr...
Q: Joan’s fishing time for the bolder boulder 10k race was 1.63 standard deviations faster than the wom...
A: In this case, the z-score indicates the standardized difference between Joan's finishing time from t...
Q: The correlation between the number of uninsured in 2006 and 2007 is calculated to be: 0.998067. Can ...
A: “Since you have asked multiple questions, we will solve the first question for you. If you want any ...
Q: From the following table, interpolate the missing values. 3 6. 4. Year 350 430 200 220 260 Productio...
A:
Q: Calculate the 75% percentiles, 25% percentiles, and the IQR for the following data: 9, 12, 20, 5...
A: Given : Observation 9 12 20 5 14 7 16 13
Q: A positive correlation coefficient means that there is a relationship between two variables. O Zero ...
A: Correlation - Is a mathematical measurement of degree of association between two variables. Positive...
Q: MODULE 9: Illustrating the Central Limit Theorem Individual work. Directions: Solve for the mean and...
A: Population Mean 550 Standard Deviation 75 Sample Size (n) Mean of the sample means Standa...
Q: If X-B(7,0.2), the mean is
A: Formula : Mean = np

Step by step
Solved in 2 steps

- The following table gives the prices of some food items in the base year and current year and the quantities sold in the base year and current year. Commodity 2000 2005 Price (K) Quantity Price (K) Quantity A 15 15 22 12 B 20 5 27 4 C 4 10 7 5 Compute the following price index numbers for 2005 from the above table: Laspeyre’s price index number Paasche’s price index numberThe following table gives the prices of some food items in the base year and current year and the quantities sold in the base year and current year. Commodity 2000 2005 Price (K) Quantity Price (K) Quantity A B C 15 20 4 15 5 10 22 27 7 12 4 5 Compute the following price index numbers for 2005 from the above table: i. Laspeyre’s price index number ii. Paasche’s price index numberThe following table is a selection of average prices for a gallon of gas in the United States. Year Gas Price Index Value 2000 $1.48 [A] 2001 $1.42 [B] 2004 $1.85 [C] 2007 $2.80 [D] Build an index from these values, using 2001 as the base year. Round each index value to the nearest tenth. [A] = [B] = [C] = [D] =
- Construct index number of price from the following data byapplying: 1)Paasche’s method Commodity Price Quantty Price QuanttyA 2 8 4 6B 5 10 6 5C 4 14 5 10D 2 19 2 13The prices and the numbers of various items produced by a small machine and stamping plant are reported below. Use 2010 as the base. 2010 2018 Item Price (in $) Quantity Price (in $) Quantity Washer 0.07 17,000 0.10 20,000 Cotter pin 0.04 125,000 0.03 130,000 Stove bolt 0.15 40,000 0.15 42,000 Hex nut 0.08 62,000 0.10 65,000 a. Determine the Laspeyres price index. (Round your answer to 2 decimal places.) b. Determine the Paasche price index. (Round your answer to 2 decimal places.)The following information is on food items for the years 2010 and 2018. 2010 2018 Item Price Quantity Price Quantity Margarine (pound) $0.81 18 $0.86 27 Shortening (pound) 0.81 5 0.91 9 Milk (1/2 gallon) 1.45 70 1.41 65 Potato chips 2.95 27 3.09 33 Compute a simple aggregate price index. Use 2010 as the base period. (Round your answer to 2 decimal places.)
- Construct index number of price from the following data byapplying: a ) Laspeyre’s method Commodity Price Quantty Price QuanttyA 2 8 4 6B 5 10 6 5C 4 14 5 10D 2 19 2 13Calculate the Price and Quantity Index numbers based on the following data; Use any two methods mentioned below. 1) Paaschey's Method 2)Fisher's Method 3) Laspeyre's Method. Data is attached in the image.The following table provides information on the number of claims (in 1 000s), as well as the average value of claims (in R 1000) for the year 2003 and 2006 at a certain medical aid. Type of claim 2003 2006 Number of claims Average claim Number of claims Average claims G.practitioners 22 42 32 56 Medicine 55 120 78 158 Dental 16 190 26 180 Specialist 36 220 28 260 Hospitalisation 18 360 20 420 Find the Paasche quantity indices for 2006 with 2003 as the base period for the claims of the medical aid company.
- Construct index number of price from the following data byapplying: Marshall-Edgeworth’s methodand comment on the results. Commodity Price Quantty Price QuanttyA 2 8 4 6B 5 10 6 5C 4 14 5 10D 2 19 2 13The following information is on food items for the years 2010 and 2018. 2010 2018 Item Price Quantity Price Quantity Margarine (pound) $0.81 18 $2.00 27 Shortening (pound) 0.84 2 1.88 9 Milk (1/2 Gallon) 1.44 74 2.89 63 Potato Chips 2.91 26 3.99 32 Compute Paasche’s index for 2018 using 2010 as the base period. (Round your answer to 2 decimal places.)Which EWMA chart below will yield ARL performance most close to that of cusum chart with k=1/2 and h=5? a. L=2.814, lamda=0.10 b. L=2.615, lamda=0.05 c. L=2.998, lamda=0.25 d. L=3.054, lamda=0.40 e. L=2.962, lamda=0.20