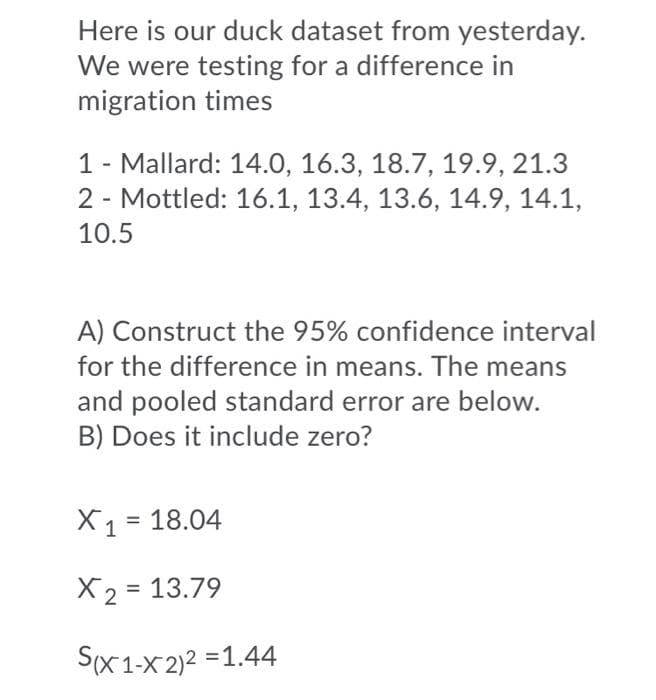
A) Construct the 95% confidence interval for the difference in means. The means and pooled standard error are below. B) Does it include zero?


Q: Here are the scores on the scores on the first exam in an introductory statistics course for 1o stud...
A: Data 80,73,92,85,75,98,93,55,80,90 Note: According to Bartleby guidelines expert solve only one que...
Q: 3.33 Suppose a certain type of small data prô Y that makes a profit is given by {ky (1-y) 0< yS1, {0...
A: The probability density function gives the probability at each possible value of a continuous random...
Q: Assume that the monthly worldwide average number of airplaine crashes of commercial airlines is 2.2....
A: poisson distribution is given by
Q: A permanent disability model has three states: State 0 (Healthy), State 1 (Sick), and State 2 (Dead)...
A: From the given information, A permanent disability model has three states: State 0 (Healthy), State ...
Q: Based on information from a previous study, r1 = 38 people out of a random sample of n1 = 104 adult ...
A: The parametric test contain the assumption of normally distribution. But the non parametric test is ...
Q: The mean annual income of certified welders is normally distributed with a mean of $50,000 and a pop...
A: The level of significance is 0.10.
Q: What is the probability of making a Type II error if the null hypothesis is actually true?
A:
Q: Temperature and Age Babies First Crawl 36 34 32 30 28 26 24 22 20 30 40 50 60 70 80 Average Monthly ...
A: Here graph is given between temperature and age babies first crawl. We have to choose correct statem...
Q: sort of financial aid. Rather than examine the records for all students, the dean randomly selects 2...
A: Given that Favorable Cases XX = 118118 Sample Size Nn= 200200 95% confidence interval for p...
Q: Are these events mutually exclusive (E) or mutually inclusive (I)? Blank 7 7. The next car you ...
A: In logic and probability theory, two events are mutually exclusive or disjoint if they cannot both o...
Q: Find the mode of the following distribution: Class - interval: 0-10 10-20 20-30 30-40 40-50 50-60 60...
A:
Q: Consider the following random experiment: A fair coin is tossed once. Here, the sample space has onl...
A:
Q: A random sample of 100 components is drawn from a population size of 1546. Assume that the populatio...
A: In the specified case, an interval (i.e., defined within an upper and lower boundary) for the popula...
Q: A sample of n=32 individuals is selected from a population with u=34 and o=8 and a treatment is admi...
A:
Q: Find the median wage of the following distribution: Wages (in $.) : 20-30 30-40 40-50 50--60 60-70 N...
A:
Q: Out of 20,000 customers' ledger accounts, a sample of 600 accounts was taken to test the accuracy of...
A:
Q: The average cost of tuition plus room and board for a small private liberal arts college is reported...
A:
Q: A random sample of 23 components is drawn from a population size of 100. The mean measurement of the...
A:
Q: Data were collected that included information on the weight of the trash (in pounds) on the street o...
A: Since you have posted a question with multiple sub-parts, we will solve the first three subparts for...
Q: (a) What is the level of significance? answer: 0.05 (c) Find the P-value of the test statistic. (R...
A: GivenLevel of significance(α)=0.05P-value=0.1467
Q: | Example 19-8. If p, q, r and s be the successive entries corresponding to equidistant arguments in...
A:
Q: Calculate the standard errors of ˆα and βˆ.
A: Answer: Hi! Thank you for the question, As per the honor code, we are allowed to answer three sub-pa...
Q: 3. Abigail is running a fundraiser for Love Week where students can buy a rose for somebody and some...
A: The 95% confidence interval for the proportion of students who would be interested in sending yellow...
Q: 2.7 Refer to #2.5 and compute the following conditional expectations: (a) E [Y|X = 1] (b) Var[Y|X = ...
A: Solution
Q: Compute Spearman's rank correlation for the following observation : 1 Candidate : 2 3 4 5 6 7 8 Judg...
A:
Q: Fill out the table below and calculate the y statistic and degrees of freedom. Blackjack Preserve Wi...
A: The Chi square χ2 test statistic formula is defined as below χ2=∑Oi-EI2EI Where, Oi is the o...
Q: 1. Which one do you think is more informative? Why? B 40 25% 30 20% 15% 10% 10 5% 0% Poor Needs Imp ...
A: Graphical representation is the visual representation of the numerical statistics by using graphs, p...
Q: Problem 3 Let X be a continuous random variable with PDF S 4z³ fx(x) = { 0 0 ).
A:
Q: Calculate Karl pearson’s coefficient of correlation from the following data: Husband’s Age 24 27 28 ...
A: Given: Husband's age, x Wive's age, y 24 18 27 20 28 22 28 25 29 22 30 28 32 28 3...
Q: In an industrial process, the diameter of a ball bearing is an important component part. The buyers ...
A: Given data : Mean(μ) = 3 standard deviation(σ) = 0.005 For Buyer I : Specification limits =[ 3 ±0.01...
Q: The sex (with categories male/female/diverse), the weight in kg and the final grade were eported for...
A: Sex weight grade f 67 2,3 m 108 3,7 m 75 1,7 d 70 2 f 71 2,7 f 73 1 Sex Category...
Q: Example 5.1 Consider two random variables X and Y with joint PMF given in Table 5.1. Table 5.1 Joint...
A:
Q: The typical probability adopted by researchers to determine whether a result is extreme is: 0.25. 0....
A: What is the typical probability adopted by researchers whether a result is extreme
Q: Suppose that a drug company wishes to test the effects of five new compounds on the growth rate of w...
A: Given information: The data represents the values corresponding to the factors Litter and Compound.
Q: (3) Let x1, X2, ·. , Xn Gamma(2, a), à > 0, a > 0. That is the density of x1 is cra-le-àx, if x > 0,...
A: We have given that Let X1 X2......Xn follows iid Gamma distribution with G(lambda, alpha) Then We...
Q: 2. In a playing card, a woman is paid P300 if she draws a jack or a queen and P500 if she draws a ki...
A:
Q: 3. In the qualifying examination for the admittance to college, the mean score was 65 and the standa...
A: “Since you have asked multiple questions, we will solve the first question for you. If you want any ...
Q: Abigail is running a fundraiser for Love Week where students can buy a rose for somebody and someone...
A: From the provided information, Sample size (n) = 380 Confidence interval is between 42.8% and 51.7%.
Q: A sampling technique used to determine error rates in populations is: а. PPS sampling. b. Variables ...
A: A sampling technique used to determine error rates in populations is: a. PPS sampling. b. Variables ...
Q: In a company that makes sports bikes, 90% of the bikes pass final inspection and 10% fail and need t...
A:
Q: Show that the bias of 0 for estimating 0 is Bias(0) 1 n+1 -0.
A: Result Bias(θ)=E(θ^)-θ≠0
Q: AGE DISTRIBUTION OF STUDENTS AT A LOCAL COLLEGE AGE NUMBER OF STUDENTS 15 – 19 34 20 - 24 68 25 – 29...
A: The total number of students is 194.
Q: (Given that ( A ) = ( B ) = ( C') =. and 80% of A's are B's, 75% of A’s are C's, find the lirits of ...
A:
Q: In a single throw of two dice, what is the probability of getting the same numbers on both dice?
A:
Q: The accompanying table shows the number of text messages sent and received by some people in one day...
A: “Since you have posted a question with multiple sub-parts, we will solve first three subparts for yo...
Q: space. (Bift>0 Be a ,r), and let (Stft>0 be the filtration generated by {Bt}t>0• Question 3: Let o b...
A:
Q: In sample 400 parts manufactured by a factory, the number of defective parts was found to be 30. The...
A: Let X be the defective parts n=sample p=5% Farmula used p^=X/n
Q: A set of final examination grades in an Introductory Statistics course is normally distributed with ...
A: We have given that, X be the test score with mean (μ) = 73 and standard deviation (σ) = 8 and The p...
Q: » Weights, in kgm. of 10 students, are given below : 38, 40, 45, 53, 47, 43, C'an we say that varian...
A:
Q: 3.4 Are X and Y independent (Yes/No)? Justify your answer.
A: X and Y are independent iff f(X,Y)=f(X)f(Y) Note: According to Bartleby guidelines expert solve onl...


Trending now
This is a popular solution!

Step by step
Solved in 2 steps with 2 images

- What is meant by the sample space of an experiment?Both students with the rural and urban background in a college music appreciation course are given an aptitude test on the first day of class. Make any necessary assumptions and construct a 99% confidence interval for the difference in music attitude if the summary of the experiment is as follows: type sample size average apitude score standard deviation Rural 9 71.4 4.1 Urban 14 86.2 3.8 A. (-18.41, -11.19) B. ( -19.54, -10.06) C. ( -18.28, -11.32) D. (-19.19, -10.41)The proportions of defective parts produced by two machines were compared, and the following data were collected. Determine a 90% confidence interval for p1 - p2. (Give your answers correct to three decimal places.) Machine 1: n = 152; number of defective parts = 17 Machine 2: n = 140; number of defective parts = 10 Lower Limit Upper Limit
- Consider the following results for two independent random samples taken from two populations. Sample 1 Sample 2 n1=50 n1=30 xbar1=13.6 xbar=11.1 pop mean 2.1 pop mean=3 What is the point estimate of the difference between the two population means? (to 1 decimal) Provide a confidence interval for the difference between the two population means (to 2 decimals).( , ) Provide a confidence interval for the difference between the two population means (to 2 decimals).( , )Out of 67,410 surgeries tracked in a study in the U.K., 2832 were followed by surgical site infections (Coello et al. 2005). a. What is a 95% confidence interval for the proportion of surgeries followed by surgical site infection in the U.K.? b. Assume that the data are a random sample.If the study had followed a total of only 674 surgeries from the same population, would the confidence interval have been wider or narrower?A researcher surveys 50 individuals in Smithville and 40 in Amherst, finding that 30% of smithville residents moved last year, while only 22% of Amherst residents did. Is there enough evidence to conclude that mobility rates in the two communities differ? Use a two-tailored alternative, and a=0.10. Again, find the p-value and a 90% confidence interval for the difference in proportions
