7. Data on fifth-grade test scores (reading and mathematics) for 436 school districts in California yield Y = 620.4 and standard deviation sy = 18.7. The 95% confidence interval for the mean test score in the population is ( 618.64 (Round your responses to two decimal places.) When the districts were divided into districts with small classes (<20 students per teacher) and large classes (≥ 20 students per teacher), the following results were found: Average Score (Y) 631.1 624.0 Class Size Small Large The (1) Hence, (3) average test scores. Standard Deviation (sy) (1) O small p-value O large p-value 18.6 17.2 Is there statistically significant evidence that the districts with smaller classes have higher average test scores? The t-statistic for testing the null hypothesis is 4.02 . (Round your response to two decimal places.) (Round your response to six decimal places.) Hint: Use the Excel can be rejected O cannot be rejected The p-value for the test is function Norm.S.Dist to help answer this question. Is there statistically significant evidence that the districts with smaller classes have higher average test scores? 622.16 ). n (3) there is 234 181 suggests that the null hypothesis (2) with a high degree of confidence. statistically significant evidence that the districts with smaller classes have higher Othere is no
7. Data on fifth-grade test scores (reading and mathematics) for 436 school districts in California yield Y = 620.4 and standard deviation sy = 18.7. The 95% confidence interval for the mean test score in the population is ( 618.64 (Round your responses to two decimal places.) When the districts were divided into districts with small classes (<20 students per teacher) and large classes (≥ 20 students per teacher), the following results were found: Average Score (Y) 631.1 624.0 Class Size Small Large The (1) Hence, (3) average test scores. Standard Deviation (sy) (1) O small p-value O large p-value 18.6 17.2 Is there statistically significant evidence that the districts with smaller classes have higher average test scores? The t-statistic for testing the null hypothesis is 4.02 . (Round your response to two decimal places.) (Round your response to six decimal places.) Hint: Use the Excel can be rejected O cannot be rejected The p-value for the test is function Norm.S.Dist to help answer this question. Is there statistically significant evidence that the districts with smaller classes have higher average test scores? 622.16 ). n (3) there is 234 181 suggests that the null hypothesis (2) with a high degree of confidence. statistically significant evidence that the districts with smaller classes have higher Othere is no

MATLAB: An Introduction with Applications
6th Edition
ISBN:9781119256830
Author:Amos Gilat
Publisher:Amos Gilat
Chapter1: Starting With Matlab
Section: Chapter Questions
Problem 1P

Related questions
Question
E4
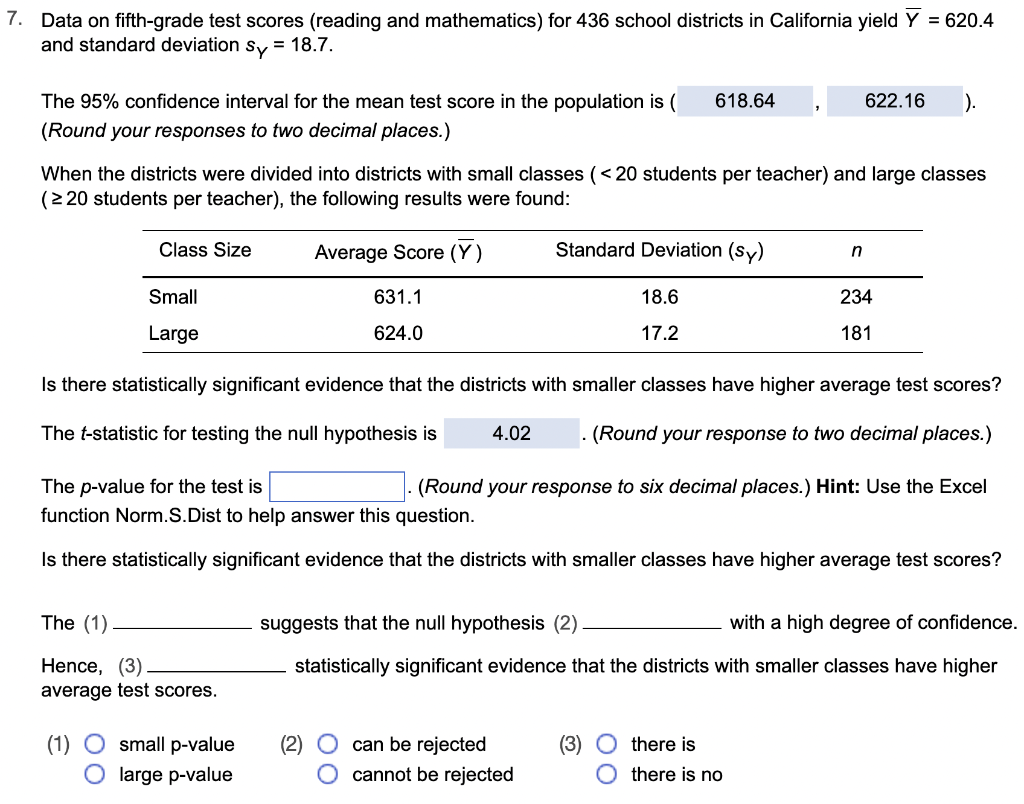
Transcribed Image Text:7. Data on fifth-grade test scores (reading and mathematics) for 436 school districts in California yield Y = 620.4
and standard deviation sy = 18.7.
The 95% confidence interval for the mean test score in the population is ( 618.64
(Round your responses to two decimal places.)
When the districts were divided into districts with small classes (<20 students per teacher) and large classes
(≥ 20 students per teacher), the following results were found:
Average Score (Y)
631.1
624.0
Class Size
Small
Large
The (1)
Hence, (3)
average test scores.
Standard Deviation (sy)
(1) O small p-value
O large p-value
18.6
17.2
Is there statistically significant evidence that the districts with smaller classes have higher average test scores?
The t-statistic for testing the null hypothesis is 4.02
. (Round your response to two decimal places.)
(Round your response to six decimal places.) Hint: Use the Excel
can be rejected
O cannot be rejected
The p-value for the test is
function Norm.S.Dist to help answer this question.
Is there statistically significant evidence that the districts with smaller classes have higher average test scores?
622.16 ).
n
(3) there is
234
181
suggests that the null hypothesis (2)
with a high degree of confidence.
statistically significant evidence that the districts with smaller classes have higher
Othere is no
Expert Solution
This question has been solved!
Explore an expertly crafted, step-by-step solution for a thorough understanding of key concepts.

Step by step
Solved in 5 steps with 5 images

Recommended textbooks for you
MATLAB: An Introduction with Applications
Statistics
ISBN:
9781119256830
Author:
Amos Gilat
Publisher:
John Wiley & Sons Inc

Probability and Statistics for Engineering and th…
Statistics
ISBN:
9781305251809
Author:
Jay L. Devore
Publisher:
Cengage Learning

Statistics for The Behavioral Sciences (MindTap C…
Statistics
ISBN:
9781305504912
Author:
Frederick J Gravetter, Larry B. Wallnau
Publisher:
Cengage Learning
MATLAB: An Introduction with Applications
Statistics
ISBN:
9781119256830
Author:
Amos Gilat
Publisher:
John Wiley & Sons Inc
Probability and Statistics for Engineering and th…
Statistics
ISBN:
9781305251809
Author:
Jay L. Devore
Publisher:
Cengage Learning
Statistics for The Behavioral Sciences (MindTap C…
Statistics
ISBN:
9781305504912
Author:
Frederick J Gravetter, Larry B. Wallnau
Publisher:
Cengage Learning

Elementary Statistics: Picturing the World (7th E…
Statistics
ISBN:
9780134683416
Author:
Ron Larson, Betsy Farber
Publisher:
PEARSON

The Basic Practice of Statistics
Statistics
ISBN:
9781319042578
Author:
David S. Moore, William I. Notz, Michael A. Fligner
Publisher:
W. H. Freeman

Introduction to the Practice of Statistics
Statistics
ISBN:
9781319013387
Author:
David S. Moore, George P. McCabe, Bruce A. Craig
Publisher:
W. H. Freeman