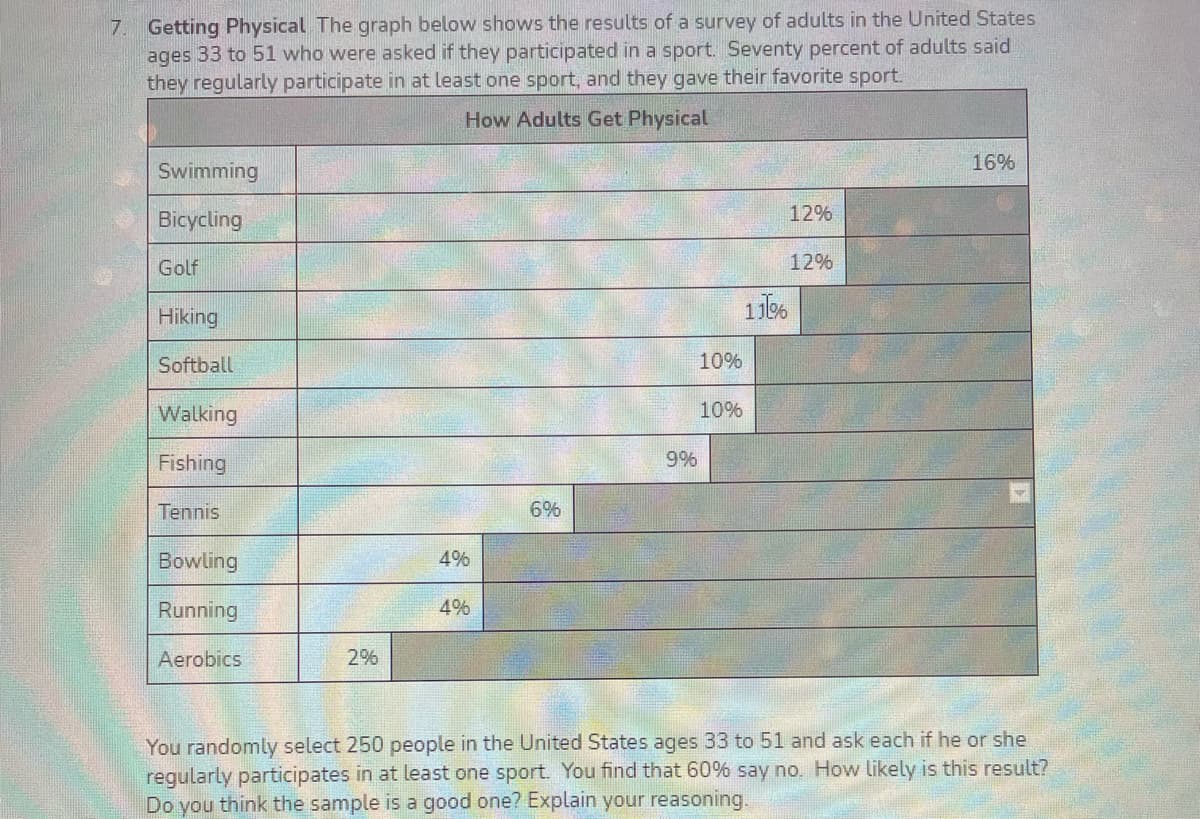
7. Getting Physical The graph below shows the results of a survey of adults in the United States ages 33 to 51 who were asked if they participated in a sport. Seventy percent of adults said they regularly participate in at least one sport, and they gave their favorite sport. How Adults Get Physical 16% Swimming Bicycling 12% Golf 12% 11% Hiking Softball 10% Walking 10% Fishing 9% Tennis 6% Bowling 4% Running 4% Aerobics 2% You randomly select 250 people in the United States ages 33 to 51 and ask each if he or she regularly participates in at least one sport. You find that 60% say no. How likely is this result? Do you think the sample is a good one? Explain your reasoning.
7. Getting Physical The graph below shows the results of a survey of adults in the United States ages 33 to 51 who were asked if they participated in a sport. Seventy percent of adults said they regularly participate in at least one sport, and they gave their favorite sport. How Adults Get Physical 16% Swimming Bicycling 12% Golf 12% 11% Hiking Softball 10% Walking 10% Fishing 9% Tennis 6% Bowling 4% Running 4% Aerobics 2% You randomly select 250 people in the United States ages 33 to 51 and ask each if he or she regularly participates in at least one sport. You find that 60% say no. How likely is this result? Do you think the sample is a good one? Explain your reasoning.

Big Ideas Math A Bridge To Success Algebra 1: Student Edition 2015
1st Edition
ISBN:9781680331141
Author:HOUGHTON MIFFLIN HARCOURT
Publisher:HOUGHTON MIFFLIN HARCOURT
Chapter11: Data Analysis And Displays
Section11.4: Two-ways Tables
Problem 26E

Related questions
Question
Please help asap :)
Transcribed Image Text:7. Getting Physical The graph below shows the results of a survey of adults in the United States
ages 33 to 51 who were asked if they participated in a sport. Seventy percent of adults said
they regularly participate in at least one sport, and they gave their favorite sport.
How Adults Get Physical
16%
Swimming
Bicycling
12%
Golf
12%
Hiking
Softball
10%
Walking
10%
Fishing
9%
Tennis
6%
Bowling
4%
Running
4%
Aerobics
2%
You randomly select 250 people in the United States ages 33 to 51 and ask each if he or she
regularly participates in at least one sport. You find that 60% say no. How likely is this result?
Do you think the sample is a good one? Explain your reasoning.
Expert Solution
This question has been solved!
Explore an expertly crafted, step-by-step solution for a thorough understanding of key concepts.

This is a popular solution!

Trending now
This is a popular solution!

Step by step
Solved in 2 steps with 1 images

Recommended textbooks for you
Big Ideas Math A Bridge To Success Algebra 1: Stu…
Algebra
ISBN:
9781680331141
Author:
HOUGHTON MIFFLIN HARCOURT
Publisher:
Houghton Mifflin Harcourt

Holt Mcdougal Larson Pre-algebra: Student Edition…
Algebra
ISBN:
9780547587776
Author:
HOLT MCDOUGAL
Publisher:
HOLT MCDOUGAL

Algebra: Structure And Method, Book 1
Algebra
ISBN:
9780395977224
Author:
Richard G. Brown, Mary P. Dolciani, Robert H. Sorgenfrey, William L. Cole
Publisher:
McDougal Littell
Big Ideas Math A Bridge To Success Algebra 1: Stu…
Algebra
ISBN:
9781680331141
Author:
HOUGHTON MIFFLIN HARCOURT
Publisher:
Houghton Mifflin Harcourt
Holt Mcdougal Larson Pre-algebra: Student Edition…
Algebra
ISBN:
9780547587776
Author:
HOLT MCDOUGAL
Publisher:
HOLT MCDOUGAL
Algebra: Structure And Method, Book 1
Algebra
ISBN:
9780395977224
Author:
Richard G. Brown, Mary P. Dolciani, Robert H. Sorgenfrey, William L. Cole
Publisher:
McDougal Littell

Algebra & Trigonometry with Analytic Geometry
Algebra
ISBN:
9781133382119
Author:
Swokowski
Publisher:
Cengage

College Algebra (MindTap Course List)
Algebra
ISBN:
9781305652231
Author:
R. David Gustafson, Jeff Hughes
Publisher:
Cengage Learning

Glencoe Algebra 1, Student Edition, 9780079039897…
Algebra
ISBN:
9780079039897
Author:
Carter
Publisher:
McGraw Hill