How The graph shows the results of a survey of adults in Country A, ages 33 to 51, who were asked if they participated in a sport. Seventy percent of adults said they regularly participated in at least one sport, and they gave their favorite sport. You randomly -adults select 250 people in Country A, ages 33 to 51, and ask them if they regularly participate in at least one sport. You find that 40% get physical say no. How likely is the result? Do you think this sample is a good one? Explain your reasoning. 16% 12% Swimming (e) Bicycing golf HIking (e) Softell, walking Fiehing 11% 10% 9% Ternis 6% 4% Aerobios 2% (te) Bowling, rurning Select the correct choice below and fill in the answer box within your choice. Round to four decimal places as needed.) O A. The result is highly likely because its probability,, is less than 0.05. O B. The result is highly likely because its probability,, is greater than 0.05. Thus, the sample is not a good representative sample. Thus, the sample is not a good representative sample. OC. The result is highly unlikely because its probability, is greater than O D. The result is highly unlikely because its probability, , is less than 0.05. 0.05. Thus, the sample is a good representative sample. Thus, the sample is not a good representative sample.
How The graph shows the results of a survey of adults in Country A, ages 33 to 51, who were asked if they participated in a sport. Seventy percent of adults said they regularly participated in at least one sport, and they gave their favorite sport. You randomly -adults select 250 people in Country A, ages 33 to 51, and ask them if they regularly participate in at least one sport. You find that 40% get physical say no. How likely is the result? Do you think this sample is a good one? Explain your reasoning. 16% 12% Swimming (e) Bicycing golf HIking (e) Softell, walking Fiehing 11% 10% 9% Ternis 6% 4% Aerobios 2% (te) Bowling, rurning Select the correct choice below and fill in the answer box within your choice. Round to four decimal places as needed.) O A. The result is highly likely because its probability,, is less than 0.05. O B. The result is highly likely because its probability,, is greater than 0.05. Thus, the sample is not a good representative sample. Thus, the sample is not a good representative sample. OC. The result is highly unlikely because its probability, is greater than O D. The result is highly unlikely because its probability, , is less than 0.05. 0.05. Thus, the sample is a good representative sample. Thus, the sample is not a good representative sample.

Glencoe Algebra 1, Student Edition, 9780079039897, 0079039898, 2018
18th Edition
ISBN:9780079039897
Author:Carter
Publisher:Carter
Chapter10: Statistics
Section10.6: Summarizing Categorical Data
Problem 10CYU

Related questions

Topic Video
Question
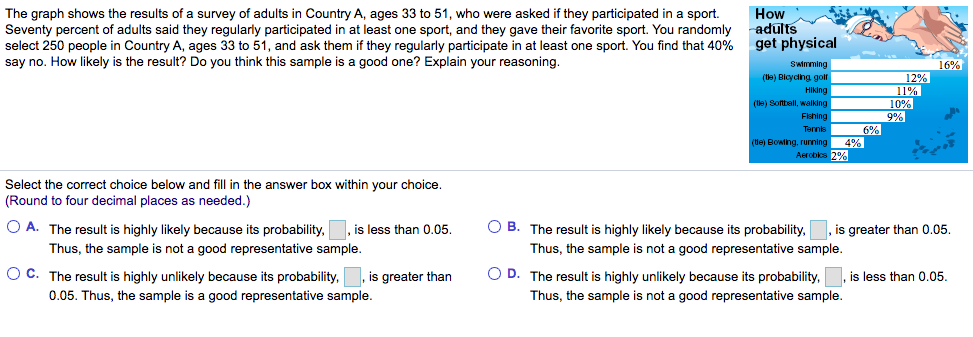
Transcribed Image Text:The graph shows the results of a survey of adults in Country A, ages 33 to 51, who were asked if they participated in a sport.
Seventy percent of adults said they regularly participated in at least one sport, and they gave their favorite sport. You randomly
select 250 people in Country A, ages 33 to 51, and ask them if they regularly participate in at least one sport. You find that 40%
say no. How likely is the result? Do you think this sample is a good one? Explain your reasoning.
How
adults
get physical
Swimming
16%
12%
11%
10%
9%
6%
(te) Bicycng golf
HIking
(tle) Softball, walking
Fishing
Ternis
(le) Bowting, rurning
4%
Aerobkes 2%
Select the correct choice below and fill in the answer box within your choice
(Round to four decimal places as needed.)
O A. The result is highly likely because its probability, , is less than 0.05.
O B. The result is highly likely because its probability, , is greater than 0.05.
Thus, the sample is not a good representative sample.
Thus, the sample is not a good representative sample.
O C. The result is highly unlikely because its probability, , is greater than
O D. The result is highly unlikely because its probability, , is less than 0.05.
0.05. Thus, the sample is a good representative sample.
Thus, the sample is not a good representative sample.
Expert Solution
This question has been solved!
Explore an expertly crafted, step-by-step solution for a thorough understanding of key concepts.

This is a popular solution!

Trending now
This is a popular solution!

Step by step
Solved in 2 steps

Knowledge Booster


Learn more about
Need a deep-dive on the concept behind this application? Look no further. Learn more about this topic, statistics and related others by exploring similar questions and additional content below.Recommended textbooks for you
Glencoe Algebra 1, Student Edition, 9780079039897…
Algebra
ISBN:
9780079039897
Author:
Carter
Publisher:
McGraw Hill

Holt Mcdougal Larson Pre-algebra: Student Edition…
Algebra
ISBN:
9780547587776
Author:
HOLT MCDOUGAL
Publisher:
HOLT MCDOUGAL
Glencoe Algebra 1, Student Edition, 9780079039897…
Algebra
ISBN:
9780079039897
Author:
Carter
Publisher:
McGraw Hill
Holt Mcdougal Larson Pre-algebra: Student Edition…
Algebra
ISBN:
9780547587776
Author:
HOLT MCDOUGAL
Publisher:
HOLT MCDOUGAL