A group reported the accompanying annual rainfall (in inches) for a particular city in Oregon over a 59 year period. 28.84 20.15 18.88 25.72 16.42 21.18 28.96 20.72 23.58 10.62 20.85 19.86 23.34 19.08 29.23 18.320 22.27 18.93 15.47 20.68 23.43 19.55 20.82 19.04 18.77 20.63 12.39 22.39 15.95 20.46 16.05 22.08 19.44 30.38 18.79 10.89 18.25 14.95 13.86 15.30 13.71 14.68 15.16 15.77 12.33 21.93 31.57 18.13 28.87 16.69 18.81 15.15 18.16 19.99 19.00 23.97 21.99 17.25 14.07 USE SALT (a) Construct a relative frequency distribution for the city's rainfall data. (Round your answers to four decimal places.) Annual Rainfall Relative Frequency 10 to 12 12 to <14 14 to <16 16 to <18 18 to <20 20 to <22 22 to <24 24 to <26 26 to <28 28 to <30 30 to <32 0.0339 0.0678 0.2712 X X X
A group reported the accompanying annual rainfall (in inches) for a particular city in Oregon over a 59 year period. 28.84 20.15 18.88 25.72 16.42 21.18 28.96 20.72 23.58 10.62 20.85 19.86 23.34 19.08 29.23 18.320 22.27 18.93 15.47 20.68 23.43 19.55 20.82 19.04 18.77 20.63 12.39 22.39 15.95 20.46 16.05 22.08 19.44 30.38 18.79 10.89 18.25 14.95 13.86 15.30 13.71 14.68 15.16 15.77 12.33 21.93 31.57 18.13 28.87 16.69 18.81 15.15 18.16 19.99 19.00 23.97 21.99 17.25 14.07 USE SALT (a) Construct a relative frequency distribution for the city's rainfall data. (Round your answers to four decimal places.) Annual Rainfall Relative Frequency 10 to 12 12 to <14 14 to <16 16 to <18 18 to <20 20 to <22 22 to <24 24 to <26 26 to <28 28 to <30 30 to <32 0.0339 0.0678 0.2712 X X X

Glencoe Algebra 1, Student Edition, 9780079039897, 0079039898, 2018
18th Edition
ISBN:9780079039897
Author:Carter
Publisher:Carter
Chapter10: Statistics
Section10.4: Distributions Of Data
Problem 19PFA

Related questions
Question
finish the table!
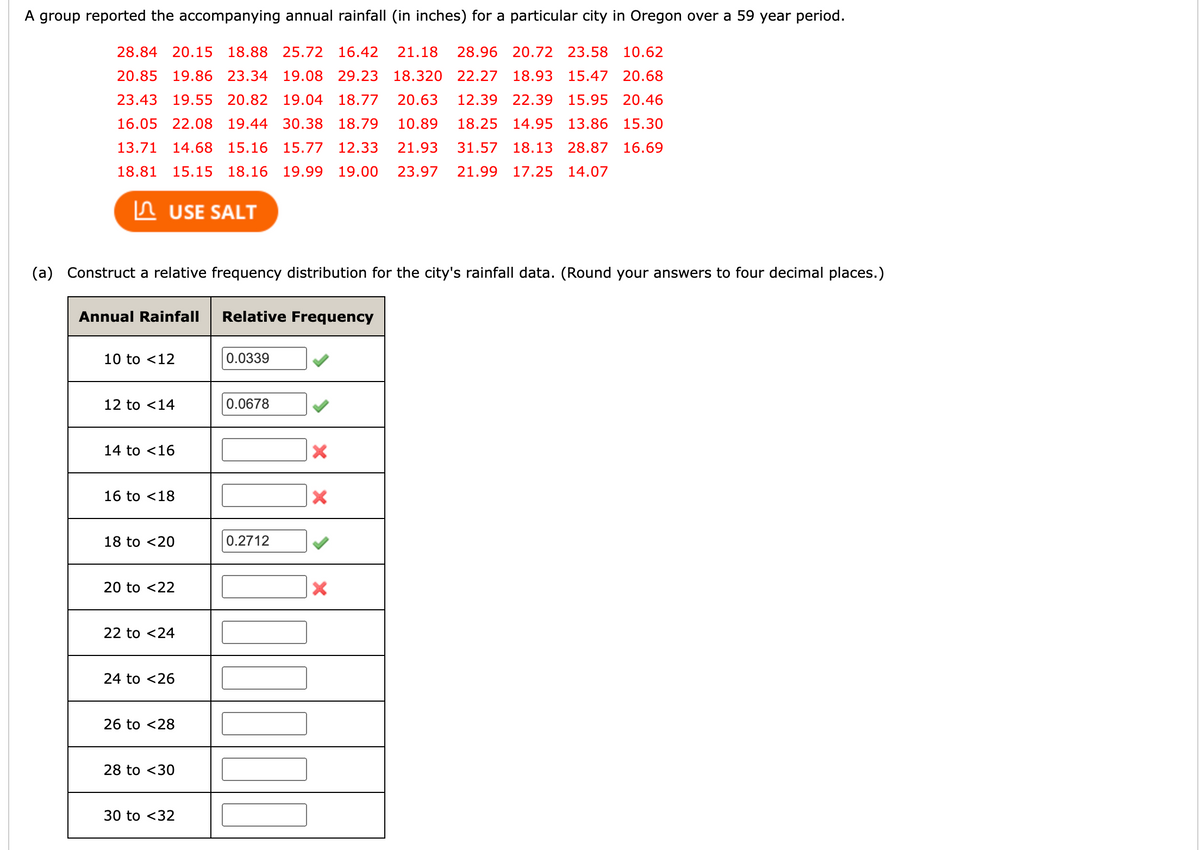
Transcribed Image Text:A group reported the accompanying annual rainfall (in inches) for a particular city in Oregon over a 59 year period.
28.84 20.15 18.88 25.72 16.42 21.18 28.96 20.72 23.58 10.62
20.85 19.86 23.34 19.08 29.23 18.320 22.27 18.93 15.47 20.68
23.43 19.55 20.82 19.04 18.77 20.63 12.39 22.39 15.95 20.46
16.05 22.08 19.44 30.38 18.79 10.89 18.25 14.95 13.86 15.30
13.71 14.68 15.16 15.77 12.33 21.93 31.57 18.13 28.87 16.69
18.81 15.15 18.16 19.99 19.00 23.97 21.99 17.25 14.07
USE SALT
(a) Construct a relative frequency distribution for the city's rainfall data. (Round your answers to four decimal places.)
Annual Rainfall Relative Frequency
10 to <12
12 to <14
14 to <16
16 to <18
18 to <20
20 to <22
22 to <24
24 to <26
26 to <28
28 to <30
30 to <32
0.0339
0.0678
0.2712
10000
X
X
X
Expert Solution
This question has been solved!
Explore an expertly crafted, step-by-step solution for a thorough understanding of key concepts.

This is a popular solution!

Trending now
This is a popular solution!

Step by step
Solved in 3 steps

Recommended textbooks for you
Glencoe Algebra 1, Student Edition, 9780079039897…
Algebra
ISBN:
9780079039897
Author:
Carter
Publisher:
McGraw Hill
Glencoe Algebra 1, Student Edition, 9780079039897…
Algebra
ISBN:
9780079039897
Author:
Carter
Publisher:
McGraw Hill