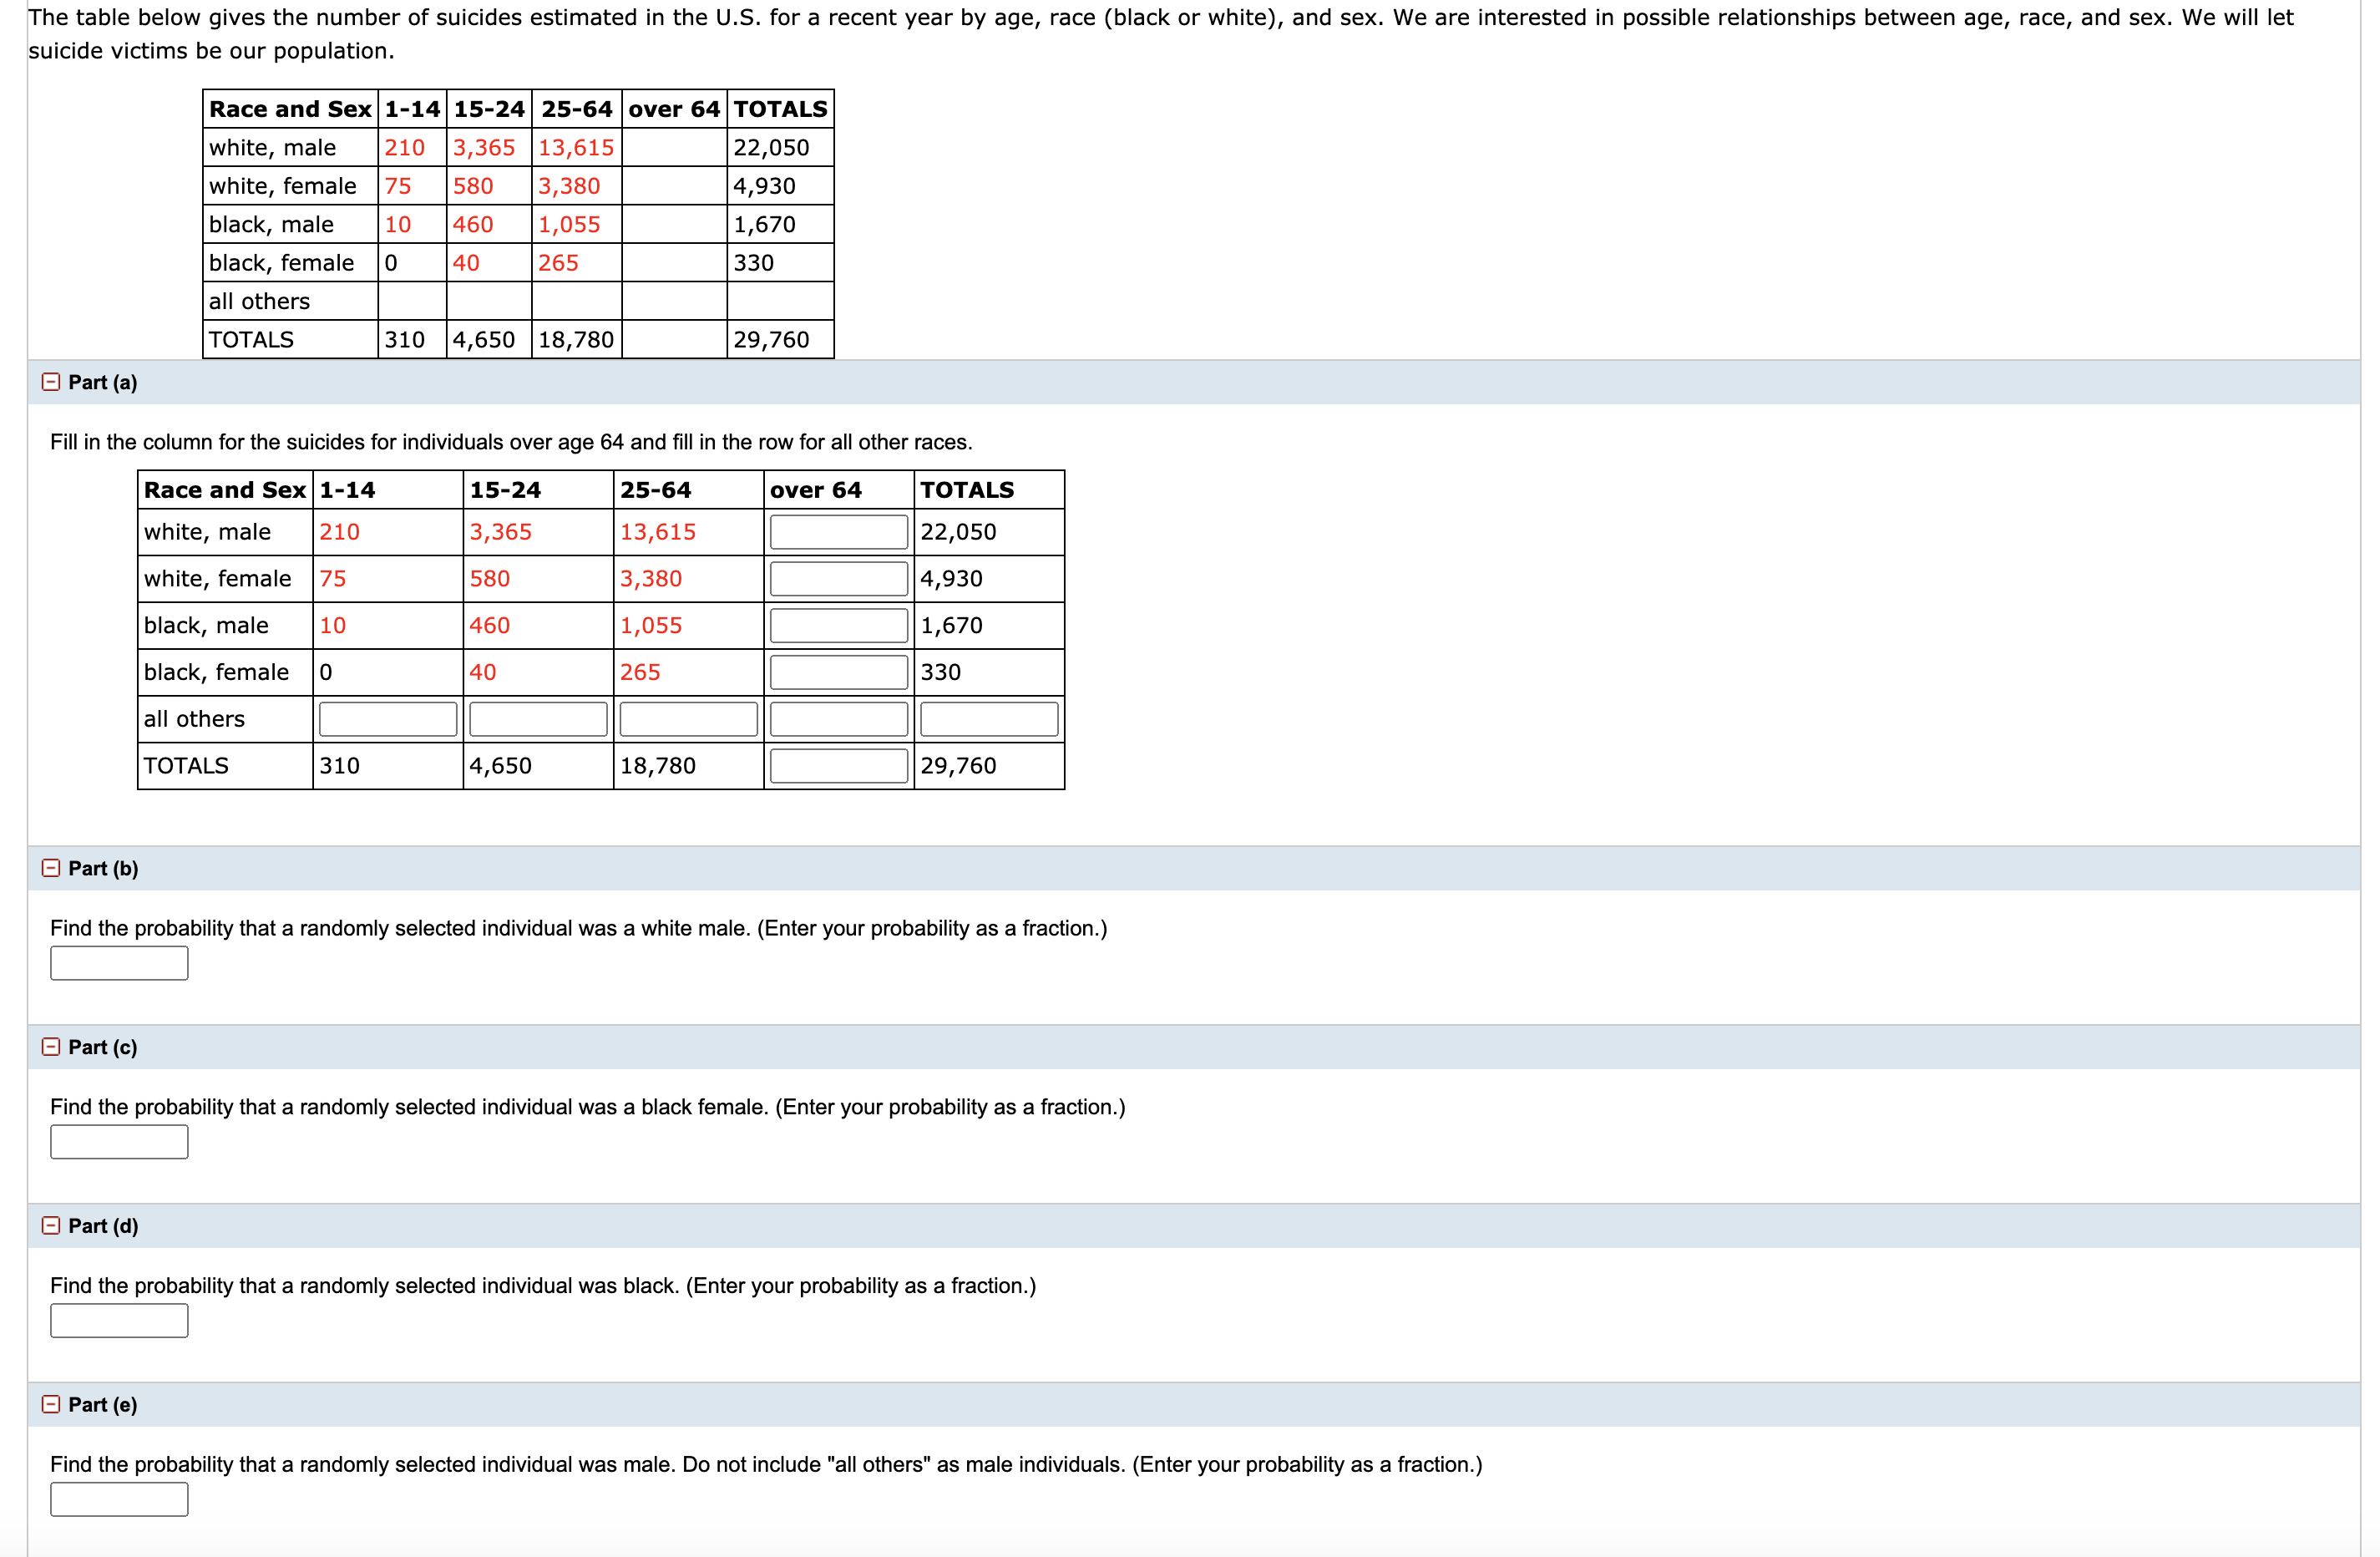
The table below gives the number of suicides estimated in the U.S. for a recent year by age, race (black or white), and sex. We are interested in possible relationships between age, race, and sex. We will let suicide victims be our population. Race and Sex 1-14 15-24 25-64 over 64 TOTALS 3,365 13,615 3,380 22,050 4,930 1,670 white, male 210 white, female black, male 75 580 10 460 1,055 black, female 40 265 330 all others TOTALS 310 4,650 18,780 29,760 Part (a) Fill in the column for the suicides for individuals over age 64 and fill in the row for all other races. Race and Sex 1-14 15-24 25-64 over 64 ТОTALS white, male 210 3,365 13,615 |22,050 white, female 75 580 3,380 4,930 black, male 10 460 1,055 1,670 black, female 40 265 330 all others TOTALS 310 4,650 18,780 29,760 O Part (b) Find the probability that a randomly selected individual was a white male. (Enter your probability as a fraction.) Part (c) Find the probability that a randomly selected individual was a black female. (Enter your probability as a fraction.) O Part (d) Find the probability that a randomly selected individual was black. (Enter your probability as a fraction.) Part (e) Find the probability that a randomly selected individual was male. Do not include "all others" as male individuals. (Enter your probability as a fraction.)
The table below gives the number of suicides estimated in the U.S. for a recent year by age, race (black or white), and sex. We are interested in possible relationships between age, race, and sex. We will let suicide victims be our population. Race and Sex 1-14 15-24 25-64 over 64 TOTALS 3,365 13,615 3,380 22,050 4,930 1,670 white, male 210 white, female black, male 75 580 10 460 1,055 black, female 40 265 330 all others TOTALS 310 4,650 18,780 29,760 Part (a) Fill in the column for the suicides for individuals over age 64 and fill in the row for all other races. Race and Sex 1-14 15-24 25-64 over 64 ТОTALS white, male 210 3,365 13,615 |22,050 white, female 75 580 3,380 4,930 black, male 10 460 1,055 1,670 black, female 40 265 330 all others TOTALS 310 4,650 18,780 29,760 O Part (b) Find the probability that a randomly selected individual was a white male. (Enter your probability as a fraction.) Part (c) Find the probability that a randomly selected individual was a black female. (Enter your probability as a fraction.) O Part (d) Find the probability that a randomly selected individual was black. (Enter your probability as a fraction.) Part (e) Find the probability that a randomly selected individual was male. Do not include "all others" as male individuals. (Enter your probability as a fraction.)

MATLAB: An Introduction with Applications
6th Edition
ISBN:9781119256830
Author:Amos Gilat
Publisher:Amos Gilat
Chapter1: Starting With Matlab
Section: Chapter Questions
Problem 1P

Related questions

Topic Video
Question
need help solving, make sure you label each part please.

Transcribed Image Text:The table below gives the number of suicides estimated in the U.S. for a recent year by age, race (black or white), and sex. We are interested in possible relationships between age, race, and sex. We will let
suicide victims be our population.
Race and Sex 1-14 15-24 25-64 over 64 TOTALS
3,365 13,615
3,380
22,050
4,930
1,670
white, male
210
white, female
black, male
75
580
10
460
1,055
black, female
40
265
330
all others
TOTALS
310 4,650 18,780
29,760
Part (a)
Fill in the column for the suicides for individuals over age 64 and fill in the row for all other races.
Race and Sex 1-14
15-24
25-64
over 64
ТОTALS
white, male
210
3,365
13,615
|22,050
white, female
75
580
3,380
4,930
black, male
10
460
1,055
1,670
black, female
40
265
330
all others
TOTALS
310
4,650
18,780
29,760
O Part (b)
Find the probability that a randomly selected individual was a white male. (Enter your probability as a fraction.)
Part (c)
Find the probability that a randomly selected individual was a black female. (Enter your probability as a fraction.)
O Part (d)
Find the probability that a randomly selected individual was black. (Enter your probability as a fraction.)
Part (e)
Find the probability that a randomly selected individual was male. Do not include "all others" as male individuals. (Enter your probability as a fraction.)
Expert Solution
This question has been solved!
Explore an expertly crafted, step-by-step solution for a thorough understanding of key concepts.

This is a popular solution!

Trending now
This is a popular solution!

Step by step
Solved in 2 steps

Knowledge Booster


Learn more about
Need a deep-dive on the concept behind this application? Look no further. Learn more about this topic, statistics and related others by exploring similar questions and additional content below.Recommended textbooks for you
MATLAB: An Introduction with Applications
Statistics
ISBN:
9781119256830
Author:
Amos Gilat
Publisher:
John Wiley & Sons Inc

Probability and Statistics for Engineering and th…
Statistics
ISBN:
9781305251809
Author:
Jay L. Devore
Publisher:
Cengage Learning

Statistics for The Behavioral Sciences (MindTap C…
Statistics
ISBN:
9781305504912
Author:
Frederick J Gravetter, Larry B. Wallnau
Publisher:
Cengage Learning
MATLAB: An Introduction with Applications
Statistics
ISBN:
9781119256830
Author:
Amos Gilat
Publisher:
John Wiley & Sons Inc
Probability and Statistics for Engineering and th…
Statistics
ISBN:
9781305251809
Author:
Jay L. Devore
Publisher:
Cengage Learning
Statistics for The Behavioral Sciences (MindTap C…
Statistics
ISBN:
9781305504912
Author:
Frederick J Gravetter, Larry B. Wallnau
Publisher:
Cengage Learning

Elementary Statistics: Picturing the World (7th E…
Statistics
ISBN:
9780134683416
Author:
Ron Larson, Betsy Farber
Publisher:
PEARSON

The Basic Practice of Statistics
Statistics
ISBN:
9781319042578
Author:
David S. Moore, William I. Notz, Michael A. Fligner
Publisher:
W. H. Freeman

Introduction to the Practice of Statistics
Statistics
ISBN:
9781319013387
Author:
David S. Moore, George P. McCabe, Bruce A. Craig
Publisher:
W. H. Freeman