7. In a survey of 1000 drivers from Region A. 859 wear a seat belt. In a survey of 1000 drivers from Region B, 904 wear a seat belt. At a = 0.01, is there evidence to support the claim that the proportion of drivers who wear seat belts in Region A is less than the proportion of drivers who wear seat belts in Region B? Assume that the samples are random and independent. Complete parts (a) through (e) below. (a) Identify the claim and state Ho and Ha. population 2 be drivers from Region B. Choose the Identify the claim. Let population 1 be drivers from Region A and correct answer below. O A. The claim is that the proportions of drivers who wear seat belts in both regions add up to 1. O B. The claim is that the proportion of drivers who wear seat belts in Region A is less than the proportion of drivers who wear seat belts in Region B. O C. The claim is that the proportions of drivers who wear seat belts in both regions are equal. D. The claim is that the proportion of drivers who wear seat belts in Region A is greater than the proportion of drivers who wear seat belts in Region B. State Ho and H. Choose the correct answer below. O A. Ho: P1 =P2 Ha: P1 + P2 O C. Ho: P1 2 P2 O B. Ho: P1 * P2 Ha: P1 = P2 H3: P1 P2 O E. Ho: P1 > P2 Ha: P1 2P2 Ha: P1 SP2 (b) Find the critical value(s) and identify the rejection region(s). Select the correct choice below and fill in the answer boxes to complete your choice. O A. There is one critical value, zo = and one rejection region, z> (Round to two decimal places as needed.) O B. There are two critical values, zo = , and two rejection regions, and z> (Use a comma to separate answers as needed. Round to two decimal places as needed.) OC. There is one critical value, zo = ,and one rejection region, z< (Round to two decimal places as needed.) (c) Find the standardized test statistic, z. Z= (Round to two decimal places as needed.) (d) Decide whether to reject or fail to reject the null hypothesis. Ho- in the rejection region(s), (2) Since z (1) enough evidence at the a=0.01 level of significance to support the claim that the proportion of the proportion of drivers who wear seat belts in Region B. (e) Interpret the decision in the context of the original claim. There (3) drivers who wear seat belts in Region A is (4)
7. In a survey of 1000 drivers from Region A. 859 wear a seat belt. In a survey of 1000 drivers from Region B, 904 wear a seat belt. At a = 0.01, is there evidence to support the claim that the proportion of drivers who wear seat belts in Region A is less than the proportion of drivers who wear seat belts in Region B? Assume that the samples are random and independent. Complete parts (a) through (e) below. (a) Identify the claim and state Ho and Ha. population 2 be drivers from Region B. Choose the Identify the claim. Let population 1 be drivers from Region A and correct answer below. O A. The claim is that the proportions of drivers who wear seat belts in both regions add up to 1. O B. The claim is that the proportion of drivers who wear seat belts in Region A is less than the proportion of drivers who wear seat belts in Region B. O C. The claim is that the proportions of drivers who wear seat belts in both regions are equal. D. The claim is that the proportion of drivers who wear seat belts in Region A is greater than the proportion of drivers who wear seat belts in Region B. State Ho and H. Choose the correct answer below. O A. Ho: P1 =P2 Ha: P1 + P2 O C. Ho: P1 2 P2 O B. Ho: P1 * P2 Ha: P1 = P2 H3: P1 P2 O E. Ho: P1 > P2 Ha: P1 2P2 Ha: P1 SP2 (b) Find the critical value(s) and identify the rejection region(s). Select the correct choice below and fill in the answer boxes to complete your choice. O A. There is one critical value, zo = and one rejection region, z> (Round to two decimal places as needed.) O B. There are two critical values, zo = , and two rejection regions, and z> (Use a comma to separate answers as needed. Round to two decimal places as needed.) OC. There is one critical value, zo = ,and one rejection region, z< (Round to two decimal places as needed.) (c) Find the standardized test statistic, z. Z= (Round to two decimal places as needed.) (d) Decide whether to reject or fail to reject the null hypothesis. Ho- in the rejection region(s), (2) Since z (1) enough evidence at the a=0.01 level of significance to support the claim that the proportion of the proportion of drivers who wear seat belts in Region B. (e) Interpret the decision in the context of the original claim. There (3) drivers who wear seat belts in Region A is (4)

Holt Mcdougal Larson Pre-algebra: Student Edition 2012
1st Edition
ISBN:9780547587776
Author:HOLT MCDOUGAL
Publisher:HOLT MCDOUGAL
Chapter11: Data Analysis And Probability
Section: Chapter Questions
Problem 8CR

Related questions

Question
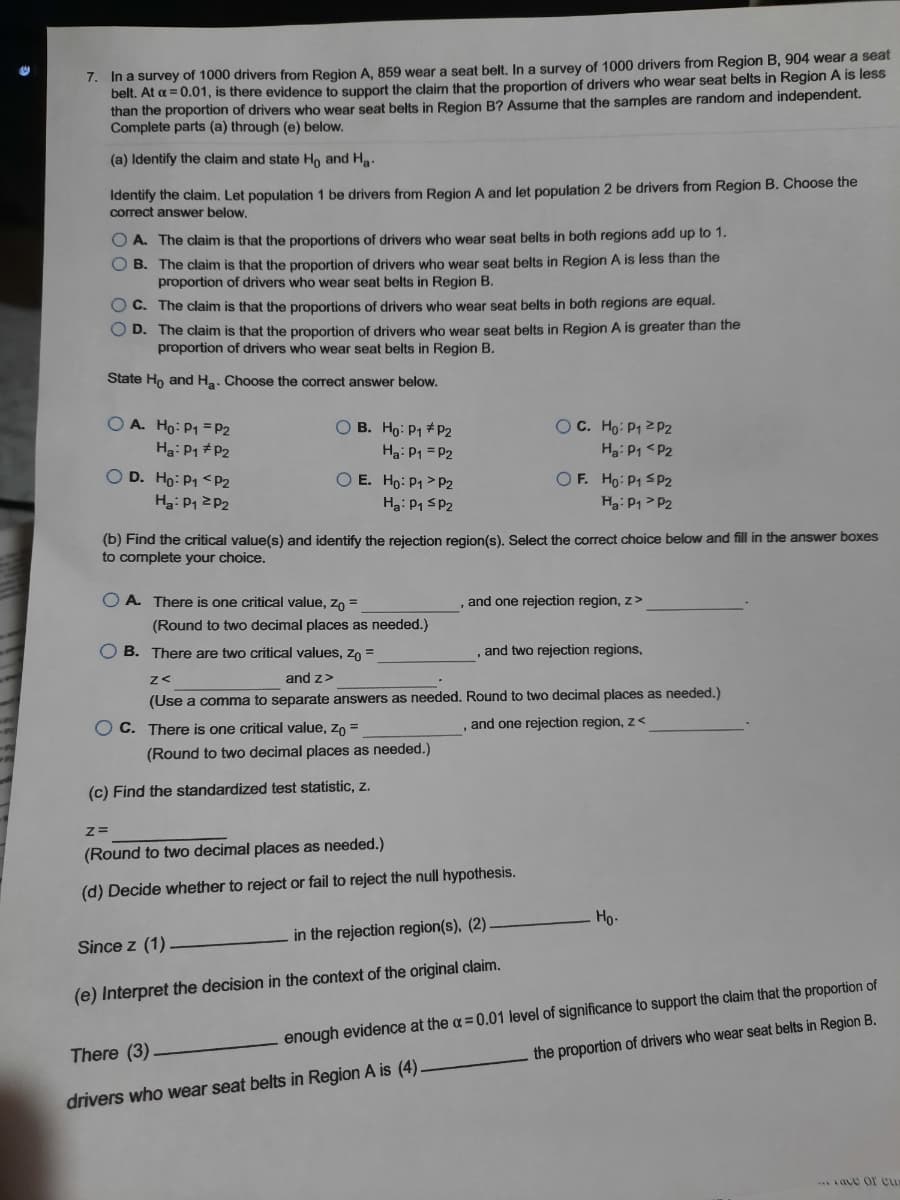
Transcribed Image Text:7. In a survey of 1000 drivers from Region A, 859 wear a seat belt. In a survey of 1000 drivers from Region B, 904 wear a seat
belt. At a = 0.01, is there evidence to support the claim that the proportion of drivers who wear seat belts in Region A is less
than the proportion of drivers who wear seat belts in Region B? Assume that the samples are random and independent.
Complete parts (a) through (e) below.
(a) Identify the claim and state Ho and Ha.
Identify the claim. Let population 1 be drivers from Region A and let population 2 be drivers from Region B. Choose the
correct answer below.
O A. The claim is that the proportions of drivers who wear seat belts in both regions add up to 1.
O B. The claim is that the proportion of drivers who wear seat belts in Region A is less than the
proportion of drivers who wear seat belts in Region B.
O C. The claim is that the proportions of drivers who wear seat belts in both regions are equal.
O D. The claim is that the proportion of drivers who wear seat belts in Region A is greater than the
proportion of drivers who wear seat belts in Region B.
State Ho and Ha. Choose the correct answer below.
O A. Ho: P1 = P2
Ha: P1 #P2
OC. Ho: P1 2 P2
Hai P1 <P2
OF. Ho: P1 SP2
O B. Ho: P1 * P2
Ha: P1 = P2
D. Ho: P1 <P2
O E. Ho: P1 > P2
Ha: P1 2P2
Hg: P1 SP2
Ha: P1 > P2
(b) Find the critical value(s) and identify the rejection region(s). Select the correct choice below and fill in the answer boxes
to complete your choice.
O A. There is one critical value, zo =
and one rejection region, z>
(Round to two decimal places as needed.)
O B. There are two critical values, zo
, and two rejection regions,
and z>
(Use a comma to separate answers as needed. Round to two decimal places as needed.)
O C. There is one critical value, zo =
, and one rejection region, z<
(Round to two decimal places as needed.)
(c) Find the standardized test statistic, z.
(Round to two decimal places as needed.)
(d) Decide whether to reject or fail to reject the null hypothesis.
Ho-
in the rejection region(s), (2)
Since z (1)
enough evidence at the a=0.01 level of significance to support the claim that the proportion of
the proportion of drivers who wear seat belts in Region B.
(e) Interpret the decision in the context of the original claim.
There (3)
drivers who wear seat belts in Region A is (4)
Expert Solution
This question has been solved!
Explore an expertly crafted, step-by-step solution for a thorough understanding of key concepts.

This is a popular solution!

Trending now
This is a popular solution!

Step by step
Solved in 4 steps

Knowledge Booster


Learn more about
Need a deep-dive on the concept behind this application? Look no further. Learn more about this topic, statistics and related others by exploring similar questions and additional content below.Recommended textbooks for you
Holt Mcdougal Larson Pre-algebra: Student Edition…
Algebra
ISBN:
9780547587776
Author:
HOLT MCDOUGAL
Publisher:
HOLT MCDOUGAL
Holt Mcdougal Larson Pre-algebra: Student Edition…
Algebra
ISBN:
9780547587776
Author:
HOLT MCDOUGAL
Publisher:
HOLT MCDOUGAL