7. Ina statistics class, a teacher is interested in seeing if merely having students sign in everyday in class wil increase attendance. Over many prior semesters of statistics teaching, it has been found that the average number of dlasses students attend is u= 24 of 30 during the semester with = 12. One semester the teacher institutes a sign-in sheet on which students sign in each day. At the end of the semester, in a classroom of n= 49 students, the students have attended an average of M= 28 classes. Test the hypothesis that the use of the sign-in sheet improved attendance. Be sure to give all the steps outlined above. Use a = .05.
7. Ina statistics class, a teacher is interested in seeing if merely having students sign in everyday in class wil increase attendance. Over many prior semesters of statistics teaching, it has been found that the average number of dlasses students attend is u= 24 of 30 during the semester with = 12. One semester the teacher institutes a sign-in sheet on which students sign in each day. At the end of the semester, in a classroom of n= 49 students, the students have attended an average of M= 28 classes. Test the hypothesis that the use of the sign-in sheet improved attendance. Be sure to give all the steps outlined above. Use a = .05.

Trigonometry (MindTap Course List)
8th Edition
ISBN:9781305652224
Author:Charles P. McKeague, Mark D. Turner
Publisher:Charles P. McKeague, Mark D. Turner
Chapter8: Complex Numbers And Polarcoordinates
Section: Chapter Questions
Problem 2RP: A Bitter Dispute With the publication of Ars Magna, a dispute intensified between Jerome Cardan and...

Related questions
Question
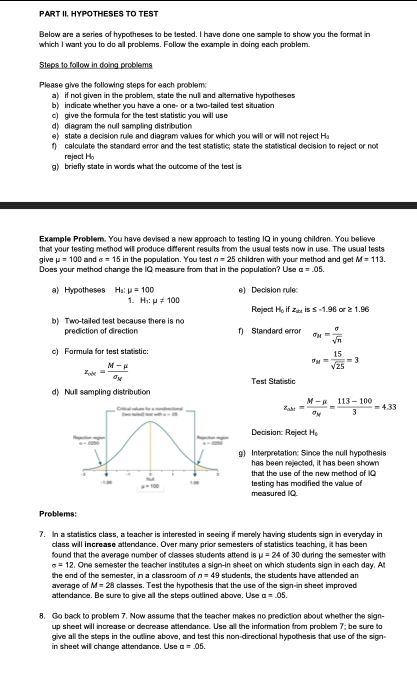
Transcribed Image Text:PART II. HYPOTHESES TO TEST
Below are a series of hypotheses to be tested. I have done one sample to show you the format in
which I want you to do all problems. Follow the example in doing each problem.
Steps to follow in doing problems
Please give the following steps for each problem:
a) if not given in the problem, state the nul and altemative hypotheses
b) indicate whether you have a one- or a two-tailed test situation
c) give the formula for the test statistic you will use
d) diagram the null sampling distribution
e) state a decision rule and diagram values for which you will or will not reject Ha
1 calculate the standard error and the test statistic; state the statistical decision to reject or not
reject Ho
g) briefly state in words what the outcome of the test is
Example Problem. You have devised a new approach to testing IQ in young children. You believe
that your testing method will produce dfferent results from the usual tests now in use. The usual tests
give p= 100 and s = 15 in the population. You test n= 25 children with your method and get M= 113.
Does your method change the IQ measure from that in the population? Use a = .05.
a) Hypotheses Ha: p = 100
e) Decision rule:
1. Hi: p 100
Reject Ho if zae is s -1.98 or 2 1.96
b) Two-tailed test because there is no
prediction of direction
n Standard error
yn
c) Formula for test statistic:
15
M-
V25
Test Statistic
d) Nul sampling distribution
M-R 113- 100
Zaht
=433
Decision: Reject He
9) Interpretation: Since the null hypothesis
has been rejected, it has been shown
that the use of the new method of 1Q
testing has modified the value of
measured IQ.
Problems:
7. Ina statistics class, a teacher is interested in seeing if merely having students sign in everyday in
class will increase attendance. Over many prior semesters of statistics teaching, it has been
found that the average number of dlasses students attend is u= 24 of 30 during the semester with
= 12. One semester the teacher institutes a sign-in sheet on which students sign in each day. At
the end of the semester, in a classroom of n= 49 students, the students have attended an
average of M = 28 classes. Test the hypothesis that the use of the sign-in sheet improved
attendance. Be sure to give all the steps autlined above. Use a= .05.
8. Go back to problem 7. Now assume that the teacher makes no prediction about whether the sign-
up sheet will increase or decrease attendance. Use all the information from problem 7; be sure to
give all the steps in the outline above, and test this non-directional hypothesis that use of the sign-
in sheet will change attendance. Use a = 05.
Expert Solution
This question has been solved!
Explore an expertly crafted, step-by-step solution for a thorough understanding of key concepts.

This is a popular solution!

Trending now
This is a popular solution!

Step by step
Solved in 4 steps with 1 images

Recommended textbooks for you
Trigonometry (MindTap Course List)
Trigonometry
ISBN:
9781305652224
Author:
Charles P. McKeague, Mark D. Turner
Publisher:
Cengage Learning

Big Ideas Math A Bridge To Success Algebra 1: Stu…
Algebra
ISBN:
9781680331141
Author:
HOUGHTON MIFFLIN HARCOURT
Publisher:
Houghton Mifflin Harcourt

Glencoe Algebra 1, Student Edition, 9780079039897…
Algebra
ISBN:
9780079039897
Author:
Carter
Publisher:
McGraw Hill
Trigonometry (MindTap Course List)
Trigonometry
ISBN:
9781305652224
Author:
Charles P. McKeague, Mark D. Turner
Publisher:
Cengage Learning
Big Ideas Math A Bridge To Success Algebra 1: Stu…
Algebra
ISBN:
9781680331141
Author:
HOUGHTON MIFFLIN HARCOURT
Publisher:
Houghton Mifflin Harcourt
Glencoe Algebra 1, Student Edition, 9780079039897…
Algebra
ISBN:
9780079039897
Author:
Carter
Publisher:
McGraw Hill

College Algebra (MindTap Course List)
Algebra
ISBN:
9781305652231
Author:
R. David Gustafson, Jeff Hughes
Publisher:
Cengage Learning

Algebra: Structure And Method, Book 1
Algebra
ISBN:
9780395977224
Author:
Richard G. Brown, Mary P. Dolciani, Robert H. Sorgenfrey, William L. Cole
Publisher:
McDougal Littell