7. Measures of effect size for the repeated-measures t Previous studies have shown that playing video games can increase visual perception abilities on tasks presented in the gaming zone of the screen (within 5 degrees of the center). A graduate student is interested in whether playing video games increases peripheral visual perception abilities or decreases attention to peripheral regions because of focus on the gaming zone. For his study, he selects a random sample of 64 adults. The subjects complete a difficult spatial perception task to determine baseline levels of their abilities. After playing an action video game (a first-person combat simulation) for 1 hour a day over 10 days, they complete the difficult perception task for a second time. Before playing the action video game, the mean score in their accuracy on the spatial task was 0.42. After playing the action video game, the mean score was 0.8 lower. The graduate student has no presupposed assumptions about whether playing video games increases peripheral visual perception abilities or decreases attention to peripheral regions because of focus on the gaming zone, so he formulates the null and alternative hypotheses as: Ho : Pp = 0 H: Pp * 0 Assume that the data satisfy all of the required assumptions for a repeated-measures t test. The graduate student calculates the following statistics for his hypothesis test: Mean difference (Mp) -0.8 Estimated population standard deviation of the differences (s) 2.4 Estimated standard error of the mean differences (SMp) 0.3000 Degrees of freedom (df) 63 The t statistic -2.67 The critical values of t when a = ,05 +1.998 Notice that since the t statistic (-2.67) is in the critical region (t < -1.998 or t > 1.998), the hypothesis test is significant when a = .05. A 95% confidence interval for the mean difference is Use Cohen's d to calculate the effect size. The absolute value of the estimated d is Using Cohen's criteria, this is a v effect size. Use r2 to calculate the effect size. The r2 is This value of r? means that, on average, % of the variability in the peripheral visual
7. Measures of effect size for the repeated-measures t Previous studies have shown that playing video games can increase visual perception abilities on tasks presented in the gaming zone of the screen (within 5 degrees of the center). A graduate student is interested in whether playing video games increases peripheral visual perception abilities or decreases attention to peripheral regions because of focus on the gaming zone. For his study, he selects a random sample of 64 adults. The subjects complete a difficult spatial perception task to determine baseline levels of their abilities. After playing an action video game (a first-person combat simulation) for 1 hour a day over 10 days, they complete the difficult perception task for a second time. Before playing the action video game, the mean score in their accuracy on the spatial task was 0.42. After playing the action video game, the mean score was 0.8 lower. The graduate student has no presupposed assumptions about whether playing video games increases peripheral visual perception abilities or decreases attention to peripheral regions because of focus on the gaming zone, so he formulates the null and alternative hypotheses as: Ho : Pp = 0 H: Pp * 0 Assume that the data satisfy all of the required assumptions for a repeated-measures t test. The graduate student calculates the following statistics for his hypothesis test: Mean difference (Mp) -0.8 Estimated population standard deviation of the differences (s) 2.4 Estimated standard error of the mean differences (SMp) 0.3000 Degrees of freedom (df) 63 The t statistic -2.67 The critical values of t when a = ,05 +1.998 Notice that since the t statistic (-2.67) is in the critical region (t < -1.998 or t > 1.998), the hypothesis test is significant when a = .05. A 95% confidence interval for the mean difference is Use Cohen's d to calculate the effect size. The absolute value of the estimated d is Using Cohen's criteria, this is a v effect size. Use r2 to calculate the effect size. The r2 is This value of r? means that, on average, % of the variability in the peripheral visual

Holt Mcdougal Larson Pre-algebra: Student Edition 2012
1st Edition
ISBN:9780547587776
Author:HOLT MCDOUGAL
Publisher:HOLT MCDOUGAL
Chapter11: Data Analysis And Probability
Section: Chapter Questions
Problem 8CR

Related questions
Question
Transcribed Image Text:ons
7. Measures of effect size for the repeated-measures t
ess Tips
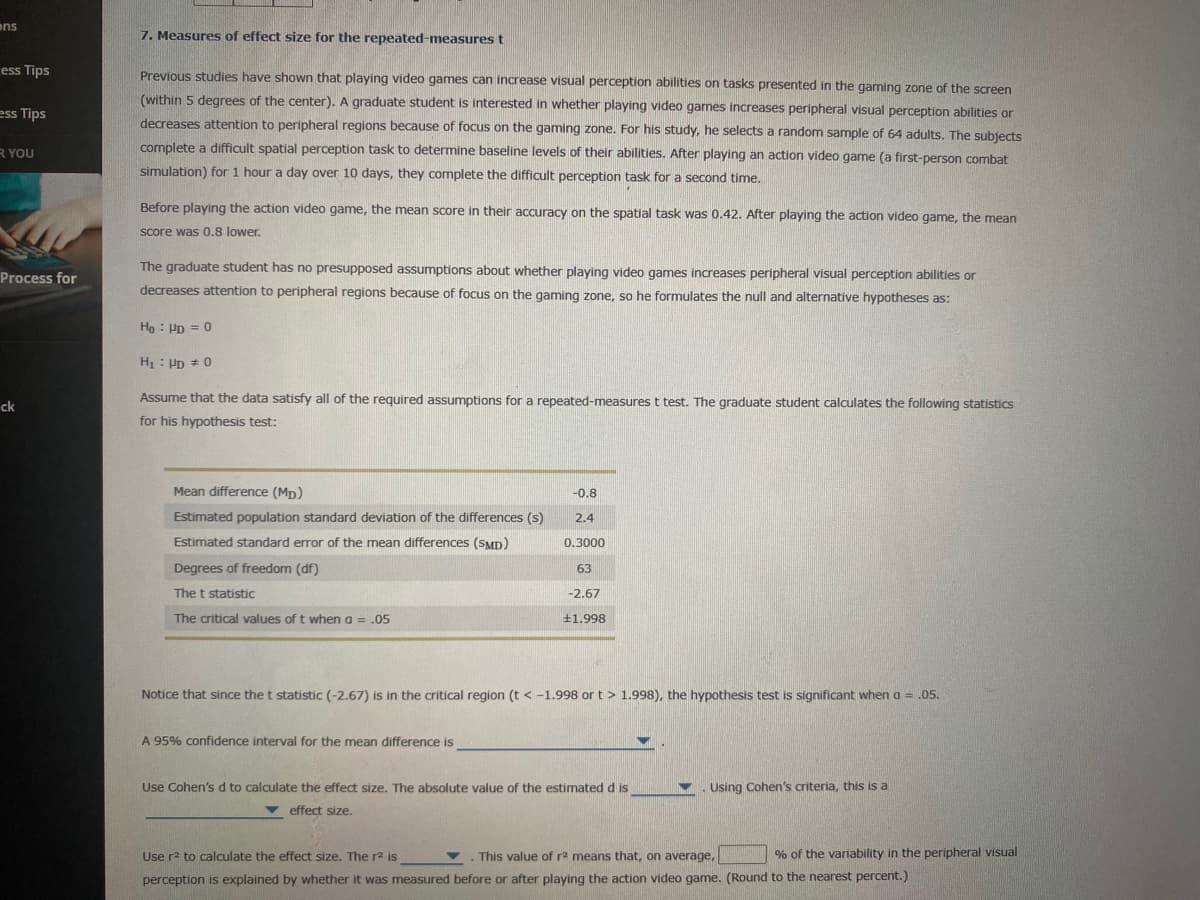
Previous studies have shown that playing video games can increase visual perception abilities on tasks presented in the gaming zone of the screen
(within 5 degrees of the center). A graduate student is interested in whether playing video games increases peripheral visual perception abilities or
ess Tips
decreases attention to peripheral regions because of focus on the gaming zone. For his study, he selects a random sample of 64 adults. The subjects
complete a difficult spatial perception task to determine baseline levels of their abilities. After playing an action video game (a first-person combat
R YOU
simulation) for 1 hour a day over 10 days, they complete the difficult perception task for a second time.
Before playing the action video game, the mean score in their accuracy on the spatial task was 0.42. After playing the action video game, the mean
Score was 0.8 lower.
The graduate student has no presupposed assumptions about whether playing video games increases peripheral visual perception abilities or
Process for
decreases attention to peripheral regions because of focus on the gaming zone, so he formulates the null and alternative hypotheses as:
Ho : Pp = 0
Hị : Pp * 0
Assume that the data satisfy all of the required assumptions for a repeated-measures t test. The graduate student calculates the following statistics
ck
for his hypothesis test:
Mean difference (Mp)
-0.8
Estimated population standard deviation of the differences (s)
2.4
Estimated standard error of the mean differences (SMD)
0.3000
Degrees of freedom (df)
63
The t statistic
-2.67
The critical values of t when a = .05
+1.998
Notice that since the t statistic (-2.67) is in the critical region (t < -1.998 or t > 1.998), the hypothesis test is significant when a = .05.
A 95% confidence interval for the mean difference is
Use Cohen's d to calculate the effect size. The absolute value of the estimated d is
Using Cohen's criteria, this is a
v effect size.
Use r2 to calculate the effect size. The r2 is
This value of r2 means that, on average,
% of the variability in the peripheral visual
perception is explained by whether it was measured before or after playing the action video game. (Round to the nearest percent.)
Transcribed Image Text:ent
* MindTap - Cengage Learning
a ng.cengage.com/static/nb/ui/evo/index.html?deploymentid=589573224712048206244311922&elSBN=9780357035108&id=1250155165&snapshotld=2521793&
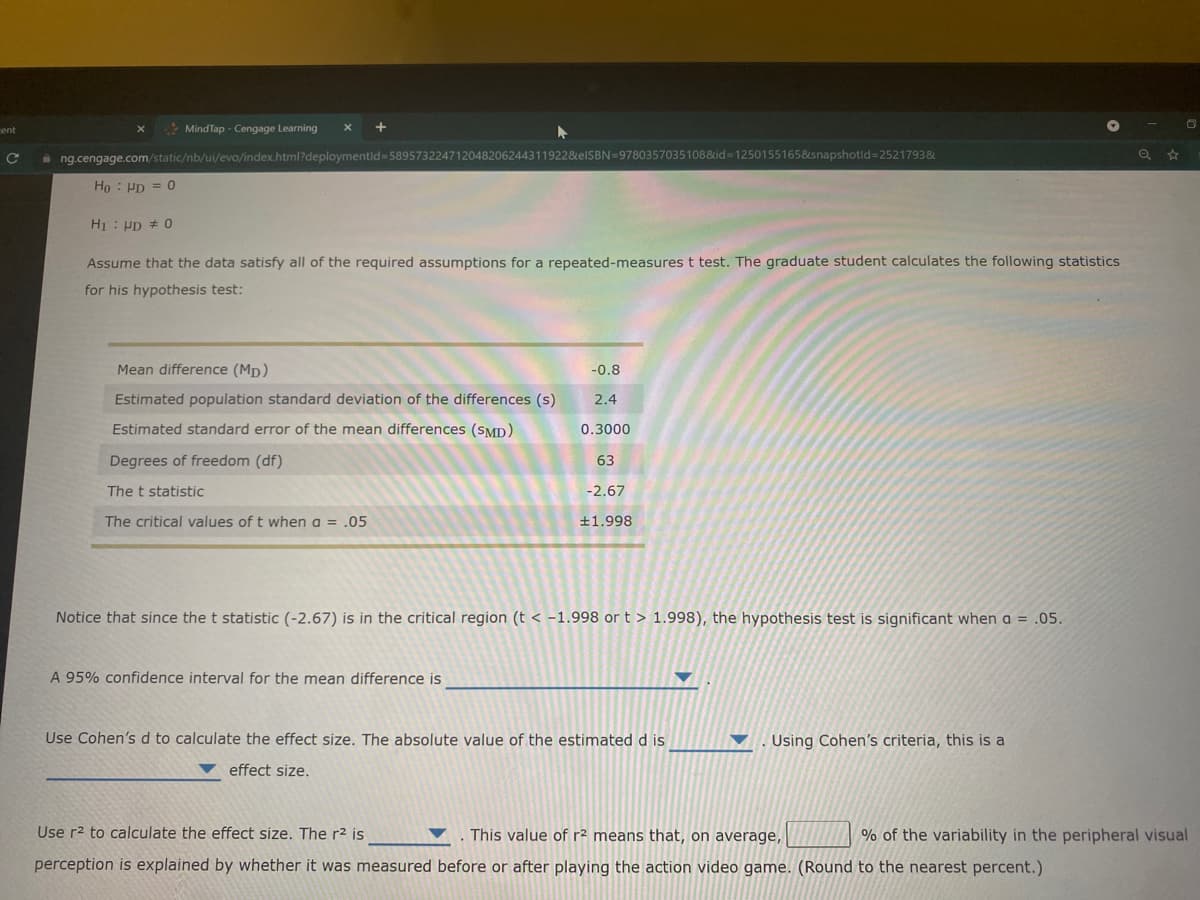
Ho : Pp = 0
H : Pp # 0
Assume that the data satisfy all of the required assumptions for a repeated-measures t test. The graduate student calculates the following statistics
for his hypothesis test:
Mean difference (Mp)
-0.8
Estimated population standard deviation of the differences (s)
2.4
Estimated standard error of the mean differences (SMD)
0.3000
Degrees of freedom (df)
63
The t statistic
-2.67
The critical values of t when a = .05
+1.998
Notice that since the t statistic (-2.67) is in the critical region (t < -1.998 or t > 1.998), the hypothesis test is significant when a = .05.
A 95% confidence interval for the mean difference is
Use Cohen's d to calculate the effect size. The absolute value of the estimated d is
Using Cohen's criteria, this is a
effect size.
Use r2 to calculate the effect size. The r2 is
This value of r2 means that, on average,
% of the variability in the peripheral visual
perception is explained by whether it was measured before or after playing the action video game. (Round to the nearest percent.)
Expert Solution
This question has been solved!
Explore an expertly crafted, step-by-step solution for a thorough understanding of key concepts.

This is a popular solution!

Trending now
This is a popular solution!

Step by step
Solved in 2 steps

Recommended textbooks for you
Holt Mcdougal Larson Pre-algebra: Student Edition…
Algebra
ISBN:
9780547587776
Author:
HOLT MCDOUGAL
Publisher:
HOLT MCDOUGAL

Glencoe Algebra 1, Student Edition, 9780079039897…
Algebra
ISBN:
9780079039897
Author:
Carter
Publisher:
McGraw Hill
Holt Mcdougal Larson Pre-algebra: Student Edition…
Algebra
ISBN:
9780547587776
Author:
HOLT MCDOUGAL
Publisher:
HOLT MCDOUGAL
Glencoe Algebra 1, Student Edition, 9780079039897…
Algebra
ISBN:
9780079039897
Author:
Carter
Publisher:
McGraw Hill