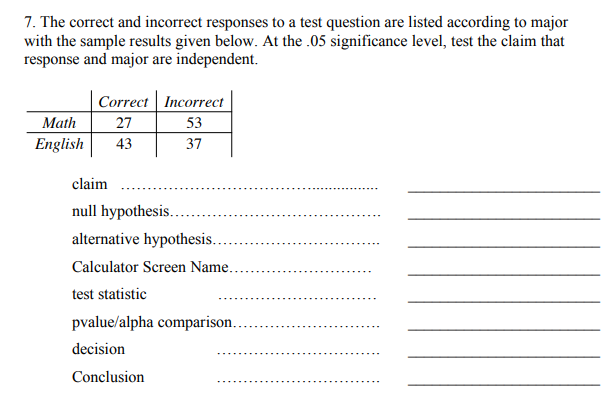
7. The correct and incorrect responses to a test question are listed according to major with the sample results given below. At the .05 significance level, test the claim that response and major are independent. Math English Correct Incorrect 53 27 43 37 claim null hypothesis.….. alternative hypothesis... Calculator Screen Name.... test statistic pvalue/alpha comparison.... decision Conclusion


Q: A coin has two sides "Lek" and "Shqip". When this coin is tossed, the probability of a "Lek" falling...
A: From the given information, Sample space = {("Lek","Lek") ("Lek" ",Shqip") ("Lek", "Shqip") ("Shqip"...
Q: If we multiply the data values by a constant (say, c), how this will affect the geometric mean? use ...
A: From the given information, It has been given that,
Q: Answer the following:Based on true statistics, list the number of confirmed cases of coronavirus COV...
A: The given data is based on COVID19 cases. Since the cases are observed day wise. Hence, the total nu...
Q: Company XYZ know that replacement times for the quartz time pieces it produces are normally distribu...
A: The provided information are: Population mean (µ)=12.8 Population standard deviation (σ) = 1.6
Q: 15. Are college students spending more or less time studying for class than in the past? This was a ...
A:
Q: A researchers says that 50% of the variance in blood pressure can be predicted from HR and that bloo...
A: Given data, Coefficient of determination r2= 50%= 0.50 Correlation coefficient (r)=?
Q: Dice. When two balanced dice are rolled, 36 equally likely outcomes are possible, as depicted in Fig...
A: Solution: Hey, since multiple sub parts are posted, we will answer first three subparts according to...
Q: Define the concept of probable error. what are its uses?
A:
Q: Assume that x has a normal distribution with the specified mean and standard deviation. Find the ind...
A: Given Information μ = 28; σ = 3.6 P(x ≥ 30)
Q: 1. The sample mean weights for two varieties of lettuce grown for 16 days in a controlled environmen...
A:
Q: The patient recovery time from a particular surgical procedure is normally distributed with a mean o...
A: d. The Z-score of a random variable X is defined as follows: Z = (X – µ)/σ. Here, µ and σ are the m...
Q: The average student loan debt for college graduates is $26,000. Suppose that that distribution is no...
A: a. The random variable, Denote X denotes the loan debt ($) of a randomly selected student. It is giv...
Q: 1.Suppose the formative and summative grades in a College Algebra class for 11 students are given be...
A: 1) The following table shows the necessary calculations for finding the mean and standard deviation:
Q: In an Algebra class, the scores on a test are normally distributed. The middle 68% of the scores fal...
A:
Q: Over the past several months, an adult patient has been treated for tetany (severe muscle spasms). T...
A:
Q: 1. Professor Gordon teaches an English course and believes that students dramatically improve their ...
A: We have given data of result of randomly selected students. Significance level, α = 0.05 Here, d = ...
Q: 1. Determine the value of the constant m so that p(x) satisfies es the conditions of being a pmf.2. ...
A: Note: Hey there! Thank you for the question. As you have posted a question with more than 3 sub-part...
Q: 4.120 Find some means. Suppose that X is a random variable with mean 20 and standard deviation 5. Al...
A: Here E(X) =20, E(Y) =40 a) The mean of Z is calculated as follows: The mean of z = 202. b) The mean...
Q: You recently took a statistics exam in a large class. The instructor tells the class that the scores...
A: The Z-score of a random variable X is defined as follows: Z = (X – µ)/σ. Here, µ and σ are the mean...
Q: Cursing Your Computer. A study was conducted by the firm Coleman&Associates, Inc. to determine w...
A: The formula for calculating odds is given below:
Q: For an F-curve with df = (6, 10), find a. F0.05. b. F0.01. c. F0.025.
A: Using Excel, The vale for the F-curve with df = (6,10) is shown below
Q: If we multiply the data values by a constant (say, c), how this will affect the geometric mean? Use ...
A: From the given information, It has been given that,
Q: On-Time Airlines. From the FlightStats On-time Performance Report Summary, we found that, in July 20...
A: Note: Thank you for the question. Since multiple sub parts are posted, according to our policy, we a...
Q: economical concerns being so great, many people are no longer purchasing new vehicles, but are inste...
A:
Q: The mean amount of time it takes a kidney stone to pass is 16 days and the standard deviation is 4 d...
A: a. It is given that the mean amount of time it takes a kidney stone to pass has a normal distributio...
Q: A Movie Festival. At a movie festival, a team of judges isto pick the first, second, and third place...
A:
Q: The following are the ratings of males by females in an experiment involving speed dating. Use the g...
A: The given dataset is: 3 4 5 6 7 7 7.5 7.5 7.5 7.5 7.5 8.5 9 9.5 9.5 ...
Q: I need help finding the answers that are highlighted yellow :) Thank you so much!
A:
Q: Why would standard z having no units of measurements be desirable for comparing data sets with diffe...
A: The Z-score is measured in terms of standard deviations from the mean. It is the statistical measure...
Q: The bar graph shows median yearly earnings of full-time workers in the United States for people 25 y...
A: Average yearly salary of an American whose final degree is a master’s is $70 thousand less than twic...
Q: Lupus is a medical phenomenon where antibodies that are supposed to attack foreign cells to prevent ...
A:
Q: Find an equation of the line with the given slope that passes through the given point. Write the equ...
A: Here, slope =2, the line passes through the point (3,3).
Q: show that the two formulae of the geometric mean are equal.?
A:
Q: In 2009 Noodles & Company introduced spaghetti and meatballs to its menu. Before putting it on t...
A: State the hypotheses. Obtain the value of the test statistic. The value of the test statistic is ob...
Q: US Universities found that 72% of people are concerned about the possibility that their personal rec...
A:
Q: An adult has on average 5.2 liters of blood. Assume the variable is normally distributed and has a s...
A:
Q: The graph illustrates a normal distribution for the prices paid for a particular model of HD televis...
A: First question: The Z-score of a random variable X is defined as follows: Z = (X – µ)/σ. Here, µ and...
Q: Define Ordinary Least Square predicted values and residuals?
A:
Q: In a normal distribution, a data value located 1 standard deviations below the mean has Standard Sco...
A: Introduction: For a normally distributed random variable, X with mean μ, and standard deviation σ, t...
Q: New research suggests that watching television especially medical shows such as Grey’s Anatomy and H...
A:
Q: Although many new moms will nurse their new babies in the beginning, the Pediatrics Association beli...
A:
Q: The Salk Vaccine. In the 1940s and early 1950s, the public was greatly concerned about polio. In an ...
A: The advantages of using double-blinding in the Salk vaccine experiment: Jonas Salk of the University...
Q: Part 2 Find the standard deviation of the number of accidents per month. When accidents occur, the p...
A: The standard deviation of the number of accidents per month is 1.0216 and it is calculated below:
Q: The mean height of an adult giraffe is 17 feet. Suppose that the distribution is normally distribute...
A:
Q: In a survey of 1402 people, 965 people said they voted in a recent presidential election. Voting re...
A: The given scenario follows binomial distribution as the sample size is large, np and nq are also gre...
Q: 12
A: a) n is increased When increasing the sample size (n), the standard error(S.E = σ/sqrt(n) decreases ...
Q: I need help finding the answers that go into the yellow highlighted boxes :) Thank you so much!!
A: From the provided information, Sample size (n) = 25 Sample mean (x̅) = 250 units Sample standard dev...
Q: A variable xx is normally distributed with mean 16 and standard deviation 5.Round your answers to th...
A: Given: Population mean = μ = 14 Population standard deviation = σ = 5 d) We have to find x when z = ...
Q: For a random sample of 36 data pairs, the sample mean of the differences was 0.81. The sample standa...
A: Given information- Sample mean, d-bar = 0.81 Sample standard deviation, s = 2 Sample size, n = 36 So...

Step by step
Solved in 2 steps with 4 images


- What is meant by the sample space of an experiment?Three different brands of automobile batteries, each one having a 42-month warranty, were included in a study of battery lifetime. A random sample of batteries of each brand was selected and lifetime (in months) was determined, resulting in the following data. Brand 1 45 39 52 47 45 41 43 Brand 2 39 44 50 53 48 47 40 Brand 3 50 47 43 48 56 44 48 State and test the appropriate hypotheses using a significance level of 0.05. State the appropriate null and alternative hypotheses. (Let ?1, ?2, and ?3 be the true mean lifetimes for the three brands.) H0 : all three of the ?i's are differentHa : ?1 = ?2 = ?3H0 : ?1 = ?2 = ?3Ha : all three of the ?i's are different H0 : ?1 = ?2 = ?3Ha : at least two of the three ?i's are differentH0 : ?1 ≠ ?2 ≠ ?3Ha : at least two of the three ?i's are the sameH0 : at least two of the three ?i's are differentHa : ?1 = ?2 = ?3 Summarize your calculations in an ANOVA table. (Round your answers to two decimal places.) Source ofVariation df…Determine whether the alternative hypothesis is supported at a 0.05 significance level. would B be correct?
- A city is collecting data on two neighborhoods, one low income and one middle income, to see whether or not their residents would support an increase in local sales tax to pay for more city services. The city wishes to see if there is evidence to show that the first neighborhood (low income) has a lower level of support for the tax compared to the second neighborhood (middle income).You wish to test the following claim (HaHa) at a significance level of α=0.002 Ho:p1=p2 Ha:p1<p2You obtain a sample from the first population with 219 successes and 131 failures. You obtain a sample from the second population with 177 successes and 53 failures.What is the test statistic for this sample? (Report answer accurate to three decimal places.)test statistic = What is the p-value for this sample? (Report answer accurate to four decimal places.)p-value = The p-value is... less than (or equal to) αα greater than αα This test statistic leads to a decision to... reject the null accept…Which of the following is the correct option for the appropriate test and degree of freedom (sd) for the hypothesis-based compliance of the data of a 6-category (class) variable, which is summarized by counting 300 pieces of data? Please select one: a. Ki square sd = 299 b. t test sd = 299 c. t test sd 5 d. Ki square sd = 49 e. Ki Square sd = 5Suppose that we are testing a null hypothesis H0 about a populationproportion, using p-value techniques. If we are using a single set of data, which of the following are notpossible? (Select all that apply. You do not need to explain.)(a) We reject H0 at the 0.10 significance level, and reject H0 at the 0.05 significance level.(b) We reject H0 at the 0.10 significance level, and fail to reject H0 at the 0.05 significance level.(c) We fail to reject H0 at the 0.10 significance level, and reject H0 at the 0.05 significance level.(d) We fail to reject H0 at the 0.10 significance level, and fail to reject H0 at the 0.05 significance level
- In a random sample of missions flown by B-17’s, 38 returned and 24 were lost. In a random sample of missions flown by B-29’s, 39 returned and 8 were lost. Use a 0.01 significance level to test the claim that the proportions of losses for B-17’s and B-29’s were equal.A grassroots group opposed to a proposed increase in the gas tax claimed that the increase would hurt working-class people the most, since they commute the farthest to work. Suppose that the group randomly surveyed 24 individuals and asked them their daily one-way commuting mileage. The results are in Table below. Using a 5% significance level, test the hypothesis that the three mean commuting mileages are the same. working-class professional (middle incomes) professional (wealthy) 17.8 16.5 8.5 26.7 17.4 6.3 49.4 22.0 4.6 9.4 7.4 12.6 65.4 9.4 11.0 47.1 2.1 28.6 19.5 6.4 15.4 51.2 13.9 9.3For the x and observed significance level (P-Value) pair, indicate whether the bull hypothesis would be rejected.
- To test the fairness of law enforcement in its area, a local citizens’ group wants to know whether women and men are unequally likely to get speeding tickets. Four hundred randomly selected adults were phoned and asked whether or not they had been cited for speeding in the last year. Using the results in the following table and a level of significance, test the claim of the citizens’ group. Let men be Population 1 and let women be Population 2.(hint - Proportions 2 sample, two tail test) Speeding Tickets Ticketed Not Ticketed Men 21 173 Women 37 169 Group of answer choices Statistic = -5.03, Accept null hypothesis Statistic = -2.03, Reject null hypothesis Statistic = -3.03, Reject null hypothesis Statistic = -2.03, Accept null hypothesisListed below are six randomly selected heights of women and men from a recent epidemiological study . Men u_{1} Women 160 168 167 153 160 177 190 170180 180 177 179 u_{2} Use a 5% significance level to test the claim that women have heights with a mean that is the same as the mean height of men. If you find evidence that the claim is true, follow up with an appropriate confidence interval and interpretation.A study of seat belt users and nonusers yielded the randomly selected sample data summarized in the accompanying table. Use a 0.05 significance level to test the claim that the amount of smoking is independent of seat belt use. A plausible theory is that people who smoke are less concerned about their health and safety and are therefore less inclined to wear seat belts. Is this theory supported by the sample data? Number of Cigarettes Smoked per Day 0 1–14 15–34 35 and over Wear Seat Belts 169 29 39 10 Don't Wear Seat Belts 153 24 34 11 a) determine the null and alternative hypothesis. b) what is the test statistic? c) whst is the P-value? d) use a significance level of 0.05 to test the claim that the amount of smoking is independent of seat belt use. A plausible theory is that people who smoke are less concerned about their health and safety and are therefore less inclined to wear seat belts. Is this…