7.1.35 uppose the lengths of human pregnancies are normally distributed with u 266 days and o = 16 days. Complete parts (a) and (b) below. B. The proportion of human pregnancies that last more than 295 days is 0.0350. Provide a second interpretation of the area using the given values. Select the correct choice below and fill in the answer boxes to complete your choice. (Type integers or decimals.) O A. The probability that a randomly selected human pregnancy lasts more than 295 days is 0.0350. O B. The probability that a randomly selected human pregnancy lasts less than days is (b) The figure to the right represents the normal curve with u = 266 days and o = 16 days. The area between x= 235 and x = 290 is 0.9069. Provide two interpretations of this area. Provide one interpretation of the area using the given values. Select the correct choice below and fill in the answer boxes to complete your choice. (Type integers or decimals. Use ascending order.) O A. The proportion of human pregnancies that last less than or more than days is O B. The proportion of human pregnancies that last between days is and Click to select and enter your answer(s) and then click Check Answer. 1 part remaining Clear All 23
7.1.35 uppose the lengths of human pregnancies are normally distributed with u 266 days and o = 16 days. Complete parts (a) and (b) below. B. The proportion of human pregnancies that last more than 295 days is 0.0350. Provide a second interpretation of the area using the given values. Select the correct choice below and fill in the answer boxes to complete your choice. (Type integers or decimals.) O A. The probability that a randomly selected human pregnancy lasts more than 295 days is 0.0350. O B. The probability that a randomly selected human pregnancy lasts less than days is (b) The figure to the right represents the normal curve with u = 266 days and o = 16 days. The area between x= 235 and x = 290 is 0.9069. Provide two interpretations of this area. Provide one interpretation of the area using the given values. Select the correct choice below and fill in the answer boxes to complete your choice. (Type integers or decimals. Use ascending order.) O A. The proportion of human pregnancies that last less than or more than days is O B. The proportion of human pregnancies that last between days is and Click to select and enter your answer(s) and then click Check Answer. 1 part remaining Clear All 23

MATLAB: An Introduction with Applications
6th Edition
ISBN:9781119256830
Author:Amos Gilat
Publisher:Amos Gilat
Chapter1: Starting With Matlab
Section: Chapter Questions
Problem 1P

Related questions
Topic Video
Question
Transcribed Image Text:7.1.35
Question Help ▼
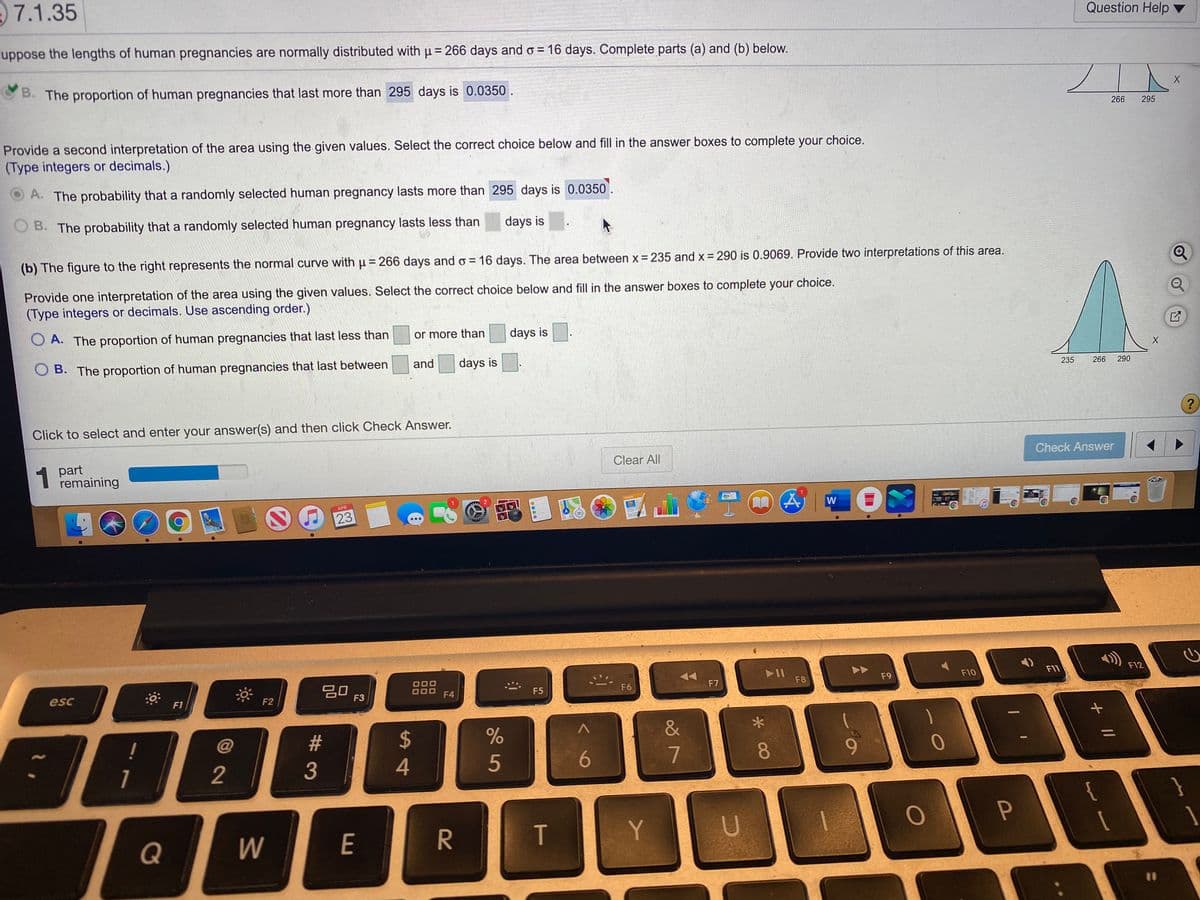
uppose the lengths of human pregnancies are normally distributed with u = 266 days and o = 16 days. Complete parts (a) and (b) below.
%3D
B. The proportion of human pregnancies that last more than 295 days is 0.0350.
266
295
Provide a second interpretation of the area using the given values. Select the correct choice below and fill in the answer boxes to complete your choice.
(Type integers or decimals.)
O A. The probability that a randomly selected human pregnancy lasts more than 295 days is 0.0350
O B. The probability that a randomly selected human pregnancy lasts less than
days is
(b) The figure to the right represents the normal curve with u = 266 days and o = 16 days. The area between x = 235 and x = 290 is 0.9069. Provide two interpretations of this area.
%3D
Provide one interpretation of the area using the given values. Select the correct choice below and fill in the answer boxes to complete your choice.
(Type integers or decimals. Use ascending order.)
O A. The proportion of human pregnancies that last less than
or more than
days is
O B. The proportion of human pregnancies that last between
and
days is
235
266
290
Click to select and enter your answer(s) and then click Check Answer.
1 part
remaining
Clear All
Check Answer
APR
W
23
O00
F12
20
F3
F8
F9
F10
F11
esc
F4
F5
F6
F7
F1
F2
!
@
2$
&
1
2
4
5
8.
9.
{
Q
W
E
T
%3D
+ II
%#3
Expert Solution
This question has been solved!
Explore an expertly crafted, step-by-step solution for a thorough understanding of key concepts.

Step by step
Solved in 2 steps with 1 images

Knowledge Booster


Learn more about
Need a deep-dive on the concept behind this application? Look no further. Learn more about this topic, statistics and related others by exploring similar questions and additional content below.Recommended textbooks for you
MATLAB: An Introduction with Applications
Statistics
ISBN:
9781119256830
Author:
Amos Gilat
Publisher:
John Wiley & Sons Inc

Probability and Statistics for Engineering and th…
Statistics
ISBN:
9781305251809
Author:
Jay L. Devore
Publisher:
Cengage Learning

Statistics for The Behavioral Sciences (MindTap C…
Statistics
ISBN:
9781305504912
Author:
Frederick J Gravetter, Larry B. Wallnau
Publisher:
Cengage Learning
MATLAB: An Introduction with Applications
Statistics
ISBN:
9781119256830
Author:
Amos Gilat
Publisher:
John Wiley & Sons Inc
Probability and Statistics for Engineering and th…
Statistics
ISBN:
9781305251809
Author:
Jay L. Devore
Publisher:
Cengage Learning
Statistics for The Behavioral Sciences (MindTap C…
Statistics
ISBN:
9781305504912
Author:
Frederick J Gravetter, Larry B. Wallnau
Publisher:
Cengage Learning

Elementary Statistics: Picturing the World (7th E…
Statistics
ISBN:
9780134683416
Author:
Ron Larson, Betsy Farber
Publisher:
PEARSON

The Basic Practice of Statistics
Statistics
ISBN:
9781319042578
Author:
David S. Moore, William I. Notz, Michael A. Fligner
Publisher:
W. H. Freeman

Introduction to the Practice of Statistics
Statistics
ISBN:
9781319013387
Author:
David S. Moore, George P. McCabe, Bruce A. Craig
Publisher:
W. H. Freeman