70 - 79 1 60 - 69 2 50 - 59 40 - 49 6. 30 - 39 4 20 - 29 1 10 - 19 1

Algebra & Trigonometry with Analytic Geometry
13th Edition
ISBN:9781133382119
Author:Swokowski
Publisher:Swokowski
Chapter1: Fundamental Concepts Of Algebra
Section: Chapter Questions
Problem 84RE

Related questions
Question
Find each of the requested values for the distribution shown in the following table.
(a) What score has a percentile rank of 60%?
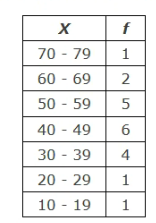
Transcribed Image Text:f
70 - 79 1
60 - 69
50 - 59
2
5
40 - 49
30 - 39
4
20 - 29
1
10 - 19
1
Expert Solution
Introduction
Given data is appropriate for measures of dispersion. Given data is in inclusive so, we need to convert into exclusive by adding +0.5 to upper limit and by subtracting -0.5 to the lower limit.

Trending now
This is a popular solution!

Step by step
Solved in 2 steps

Knowledge Booster


Learn more about
Need a deep-dive on the concept behind this application? Look no further. Learn more about this topic, statistics and related others by exploring similar questions and additional content below.Recommended textbooks for you
Algebra & Trigonometry with Analytic Geometry
Algebra
ISBN:
9781133382119
Author:
Swokowski
Publisher:
Cengage
Algebra & Trigonometry with Analytic Geometry
Algebra
ISBN:
9781133382119
Author:
Swokowski
Publisher:
Cengage