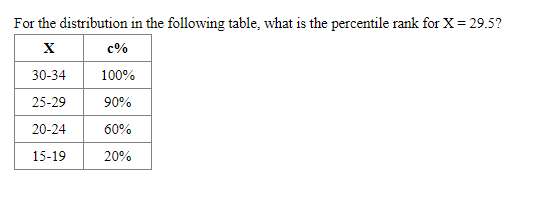
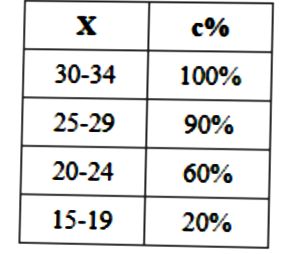
For the distribution in the following table, what is the percentile rank for X = 29.5? c% 30-34 100% 25-29 90% 20-24 60% 15-19 20%


Q: Calculate the 55th percentile of the data shown x 2.8 3.5 4.3 7.3 9.2 19.1
A: Number of observation (n) = 6 55th percentile (P55) = Pk
Q: Find each of the requested values for the distribution shown in the following table. (d) What is…
A: Given data is appropriate for measures of dispersion to find the percentile for the given data . But…
Q: 3. For the distribution in the following table, what is the 50" percentile? X 9. c% 100% 80% 50% 25%…
A: 3.
Q: 4. Using the frequency distribution table below, what is the proportion of individuals that scored a…
A:
Q: Find each of the requested values for the distribution shown in the following table. (a) What score…
A: Percentile Rank (PR): It is the measure of the relative performance, where it is the percentage of…
Q: What is the mean for the population of scores presented in the frequency distribution table below?…
A: The given table shows the frequency distribution table of the scores.
Q: For the distribution in the following table, what is the percentile rank for X = 8.5?
A: Given that X C% 9 100% 8 80% 7 50% 6 25% Here, Percentile rank for x=8.5
Q: What is the median for the population of scores shown in the frequency distribution table? X f 5…
A: Step 1: The frequency distribution table is, Step 2: Obtaining the cumulative frequencies…
Q: For the following distribution of z-scores location, what is the portion in the tail? z = 2.00…
A: Standard normal distribution: The standard normal distribution is a special case of normal…
Q: 70 - 79 1 60 - 69 2 50 - 59 40 - 49 6. 30 - 39 4 20 - 29 1 10 - 19 1
A: Given data is appropriate for measures of dispersion. Given data is in inclusive so, we need to…
Q: 2. Using the following distribution of scores, find the 15th percentile. X 20-24 15-19 10-14 5-9 0-4…
A:
Q: Find the 1st quartile, 7th decile, 35th percentile, and percentile rank of 115 and 155 for the…
A:
Q: Test Grades F 30 - 39 8 40 - 49
A: According to the sum, Class Interval CF(greater than type) CF(less than type) f (frequency)…
Q: Draw a polygram for the distribution of scores shown below x f 6 2 5 5 4 3 3…
A:
Q: If the shaded area corresponds to z=-0.90, what proportion of the distribution corresponds to z >…
A: We have given that the shaded area correspond to z = -0.90.
Q: Jocelyn has an assignment to ask at random 10 of her classmates about their grades in Math. The data…
A: Given : Grades : 89,76,75,88,75,72,84,80,75,81 number of students (n)=10 Percentile formula :…
Q: What score has a percentile rank of 50%?
A: From the given information: n=20 k=50 Therefore, using this following formula to find the LP…
Q: For the distribution in the following table, what is the percentile rank for X = 8.5? X…
A:
Q: For the following ordered set of data, find the 60th percentile. 0, 2, 3, 5, 5, 6, 8, 10, 10, 11,…
A: Note: If "L" is a whole number then the value of the kth percentile is the midway between Lth value…
Q: Find the 14th percentile, P14, from the following data 2 8. 9 16 22 23 26 35 37 38 39 41 51 62 63 69…
A: For the given data sample size is, n= 29 14th percentile is given by, P14= 14*(n+1)/100 th term
Q: d the 74th percentile, P74, from the following data 3 7 12 17 23 25 28 29 36 38 44 51 63 66 67 72 75…
A: Given : Sample size (n)=22 3 7 12 17 23 25 28 29 36 38 44 51 63 66 67 72 75 83 85 91 99…
Q: For the following distribution of z-scores location, what is the portion in the tail? z= -2.00 z=…
A: A standard normal variable z follows normal distribution with mean 0 and standard deviation 1.
Q: For the distribution in the following table, what is the 50" percentile? X c% 100% 80% 9. 8. 7 50%…
A: The pth percentile of a set of observations is the value below which, p% or (p/100) proportion of…
Q: Find the lower and upper quartiles, 8h decile, 45th percentile, and the coefficient of skewness for…
A: Solution-: We have following table: Class Freq (fi) 30-50 15 50-70 12 70-90 19 90-110 14…
Q: From the data diven below, what value corresponds to the 40th percentile? 804 736 659 489…
A: Given : n=9 Data 804 736 659 489 777 623 597 524 228
Q: Use a table of z-scores and percentiles to find the percentage of data items in a normal…
A:
Q: What is the total number of scores (N) for the distribution shown in the following table? X…
A: Given data
Q: For the following scores below: a. Construct a frequency distribution table. b. Sketch a histogram…
A:
Q: For the sample of scores in the following frequency distribution table, what is the standard…
A: Given: n= ∑f=11
Q: The number of traffic violations recorded by a police department for 10 days is shown. Find the…
A:
Q: 6. The following data gives the distribution of marks scored by a set of students. Find the mean and…
A:
Q: Using the following distribution of scores, find the percentile rank corresponding to X=7.0: X…
A: Given Data : X f 10 2 9 8 8 4 7 6 6 4 5…
Q: percentile rank for X = 45?
A: Percentile Rank: The percentile rank of a score is the percentage of scores in its frequency…
Q: 0.38 0.76 0.85
A: As per given by the question, there are three points are given and find the percentile points for…
Q: The following data are given to an economist for the purpose of economic analysis. The data refers…
A: Solution-: Form given information we get, n=100,∑f*d=50,∑f*d2=1970,∑f*d3=2948, f*d4=86752,d=X-48 We…
Q: For the distribution in the following table, what is the 60th percentile? c% 50-59 100% 40-49 90%…
A:
Q: Compute the 35th percentile, the 55th percentile, Q₁, Q2, and Q3 for the following data. 14 26 28 11…
A: Sol:- P35 The percentile no. p is a value such that at least p percent of the observations is less…
Q: For the following distribution, what percentage of the individuals have scores of X= 1? X 4 8. 3 2 3…
A: The formula for calculating the probability for frequency table is, The below table shows the…
Q: Find the 1ª quartile, 7th decile and 35th percentile of the following distribution. Class Interval…
A: The following information has been given: Class Interval Frequency 151 - 160 8 141 - 150 12…
Q: What is the mode for the population of scores presented in the frequency distribution table below?…
A: Mode is the value from data set which occurred highest number of times. That is the value with…
Q: For the following distribution of quiz scores, what is E X? 6 4 3 1 1 3 4 5 X 2. 2.
A: We have given the distribution of Quiz scores. Summarizing the data in the form of a table- x f…
Q: Find the mean of the distribution shown below. 3. 7 P(X) 0.21 0.07 0.58 0.14 O 6.23 0.25 O 24
A: To find the mean of the distribution
Q: Calculate the 30th percentile of the data shown x 4.8 12.8 17.3 22.9 26.2
A: Given: Number of observation (n) = 5 30th percentile (P30)= Pk
Q: Find the mean, median, and mode for the scores in the following frequency distribution table. X f…
A: Consider the following rearrangement of the data in the table: x f 0 2 1 0 2 3 3 2 4 5…
Q: For the following distribution of z-scores location, what is the portion in the tail? z = 2.00…
A:
Q: Find each value requested for the distribution of scores in the following table. а. п b. ΣΧ c. EX? f…
A:
Q: For the following data. The 25th percentile is 16, 25, 4, 18, 11, 13, 20, 8,11, 9 اختر احدى الدجابات…
A: We have given that, The data set is, 16, 25, 4, 18, 11, 13, 20, 8, 11, 9 Then, We will find the…
Q: The following data are given to you to find out whether the distribution is platykurtic N= 100, Efd,…
A: Concentration of all the values around the central value of the given data is known as measures of…
Q: In the following data set (listed from lowest to highest), find the percentile of 8.3. 2.6 3.9…
A: We have given data. 2.6 3.9 4.1 4.5 4.5 4.7 4.7 5.6 5.9 6.4 6.4 7.5 7.5…
* ANSWER :-
Given that,
The distribution table is

Trending now
This is a popular solution!

Step by step
Solved in 2 steps with 1 images
