7-12 Singing Order Actual Eliminations 6. 9. 12 20 12.9 13.5 Expected Eliminations 7.9 6.4 5.5 12.9 9.9 LO st 3.


Contingency Table
A contingency table can be defined as the visual representation of the relationship between two or more categorical variables that can be evaluated and registered. It is a categorical version of the scatterplot, which is used to investigate the linear relationship between two variables. A contingency table is indeed a type of frequency distribution table that displays two variables at the same time.
Binomial Distribution
Binomial is an algebraic expression of the sum or the difference of two terms. Before knowing about binomial distribution, we must know about the binomial theorem.
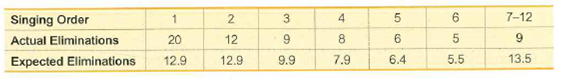
American Idol Contestants on the TV show American Idol competed to win a singing contest. At one point, the website WhatNotToSing.com listed the actual numbers of eliminations for different orders of singing, and the expected number of eliminations was also listed. The results are in the table below. Use a 0.05 significance level to test the claim that the actual eliminations agree with the expected numbers. Does there appear to be support for the claim that the leadoff singers appear to be at a disadvantage?


Trending now
This is a popular solution!

Step by step
Solved in 3 steps with 3 images


