Flight 3 Flight 19 Flight 21 22 -5 3. -8 8. -11 -4 19 -5 -4 73 -1 -1 60 18 47 13 142 -11 -1 47 Sum of Mean Source DF squares Pr>F 2 4263.0833 2131.5417 1.9104 0.1729 squares Q1
Flight 3 Flight 19 Flight 21 22 -5 3. -8 8. -11 -4 19 -5 -4 73 -1 -1 60 18 47 13 142 -11 -1 47 Sum of Mean Source DF squares Pr>F 2 4263.0833 2131.5417 1.9104 0.1729 squares Q1

Algebra & Trigonometry with Analytic Geometry
13th Edition
ISBN:9781133382119
Author:Swokowski
Publisher:Swokowski
Chapter10: Sequences, Series, And Probability
Section10.6: Permutations
Problem 13E

Related questions
Question
In Exercises 1-5, refer to the following list of departure delay times (min) of American Airline flights from JFK airport in New York to LAX airport in Los Angeles. Assume that the data are samples randomly selected from larger populations.
ANOVA The XLSTAT display below results from using the one-way analysis of variance test with the three samples.
a. What is the null hypothesis?
b. Assuming a 0.05 significance level, what conclusion is indicated by the displayed results?
XLSTAT
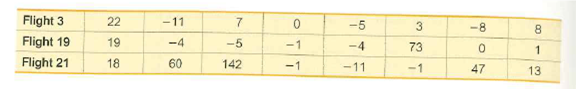
Transcribed Image Text:Flight 3
Flight 19
Flight 21
22
-5
3.
-8
8.
-11
-4
19
-5
-4
73
-1
-1
60
18
47
13
142
-11
-1
47
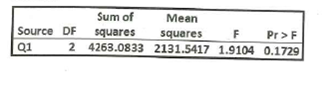
Transcribed Image Text:Sum of
Mean
Source DF
squares
Pr>F
2 4263.0833 2131.5417 1.9104 0.1729
squares
Q1
Expert Solution
This question has been solved!
Explore an expertly crafted, step-by-step solution for a thorough understanding of key concepts.

This is a popular solution!

Trending now
This is a popular solution!

Step by step
Solved in 2 steps

Knowledge Booster


Learn more about
Need a deep-dive on the concept behind this application? Look no further. Learn more about this topic, statistics and related others by exploring similar questions and additional content below.Recommended textbooks for you
Algebra & Trigonometry with Analytic Geometry
Algebra
ISBN:
9781133382119
Author:
Swokowski
Publisher:
Cengage
Algebra & Trigonometry with Analytic Geometry
Algebra
ISBN:
9781133382119
Author:
Swokowski
Publisher:
Cengage