7)The specifications for a certain kind of energy drink has an average sugar content of 14.0 grams. In an attempt to show that it differs from this value, a random sample of five energy drinks are selected from different cartons to measure its sugar content (grams per bottle). 14.6 14.4 14.3 14.5 14.2 Based on this sample, is the production under control? Use a 0.05 level of significance and assume that the distribution of sugar content is normally distributed.
Q: Suppose a gambler plays roulette 400 times, betting $1 on each play on red. Recall from the previous...
A:
Q: b) If there are 3.000 plants in the field, approximately how many will be taller than 71 in?
A: Here use basic of normal distribution
Q: X1,X2,...,Xn are i.i.d. random variables from N(0,θ) distribution. Here, θ= σ2 >0 is the variance of...
A:
Q: Refer to the figure at the right. At a= 0.10, can you reject the claim that the proportion of 18 to ...
A:
Q: Let X be a random variable that represents the number of times an image (H) appears. Find average (M...
A: By observing the above problem, we easily see that the distribution of X follows a Binomial Distribu...
Q: In a survey of 500 drivers from the South, 408 wear a seat belt. In a survey of 370 drivers from the...
A:
Q: Find the 98% confidence interval for the cigarette tax in all 50 states.
A: Here use given sample data And here population size is Finite N= 50
Q: . How many 3-digit numbers can be formed from the digits 1, 2, 3, 5, 6, 7, 8 and 9 if repetition of ...
A:
Q: Describe what participation bias is and how it affects the results of a study. Give an example. O Tr...
A: During the process of data collection for a research, there can be multiple ways a researcher can in...
Q: 1. The following table shows the number of absences and grades of 2 students in a Differential Equat...
A: The objective is to compute r i.e correlation coefficient and to determine grades in differential eq...
Q: Two groups of customers A and B, have certain fruit drink preferences, consisting of 100 people each...
A: To infer a conclusion regarding the change in preference for certain fruit drinks by the customers u...
Q: Consumer Reports tested 14 brands of vanilla yogurt and found these numbers of calories per serving:...
A: a) Conditions:1. SRS Stated2. pop > 10n That is, 10(14) = 140 There are more than 140 yogurts3. n...
Q: The test scores for two statistics classes are shown below. Morning Class:88, 74, 69, 71, 58, 74, ...
A: Given Table of Morning Class and Evening Class Find (a) For each data set, create a frequency table ...
Q: llustration 9.33. The following data represent travel expenses ( 'her than transportation) for 7 tri...
A:
Q: Let X be a random variable with distribution function F(x) = 1-e*,x > 0, then the p.d.f of X is
A: Here given cumulative distribution function of x
Q: Which one of the following statements is true? The sample proportion is a parameter. A confidence...
A: It is needed to find the true statement.
Q: Gold Silver Boys Girls 3 6. 9. A student is randomly selected. Find the probability (in exact fracti...
A: Gold Silver Bronze Total Boys 3 7 5 15 Girls 6 2 9 17 Total 9 9 14 32
Q: 0.20, p3 = 0.10 respectively. What is the probability that all five chips 0.70, p2 = must be reinspe...
A: here given, An inspection plan calls for inspecting five chips and for either accepting each chip, r...
Q: he expected value is $O Round to the nearest cent as needed.)
A: Here we will Use Basics of expected value
Q: Assume that in this question adults spend an average of 104.1 minutes with a standard deviation of 2...
A:
Q: ustration 10.28. Compile a table, showing the frequencies with which words of different numbers of l...
A:
Q: The mean of the sampling distribution of sample means is equal to the population mean. Justify why t...
A:
Q: A real estate company is interested in the ages of home buyers. They examined the ages of thousands ...
A: Given that mu = 49 ,sigma =11
Q: Sales representatives earned these commissions last month: PhP 4377.00 PhP 3183.00 PhP 1970.00 PhP 2...
A: Given data is 4377.00,3183.00,1970.00,2270.00,3860.00,2508.00,1569.00
Q: The general model for a Shewhart control chart is given as: Ow UCL Hw + Za/2 LCL = µw – Za/2 - If th...
A: The Shewhart control chart has a upper and lower limits. Measurements are plotted on the chart versu...
Q: Using the data below make a frequency distribution table containing the following: 1. classes with ...
A: Frequency distribution table : A distribution table is one approach to organize knowledge to form it...
Q: (3) The probability that a truck will be going over the speed limit on I-77 South between Dobson and...
A: ( 3 ) Given that n =5 ,p=0.75
Q: 8. The Muscat Distributing Company is investigating two different scheduling methods for its truck d...
A: The coefficient of variation is used to measure the relative distribution of data set. It is calcula...
Q: The weight of an energy bar is approximately normally distributed with a mean of 42.35 grams with a ...
A: Note: Please repost remaining sub-parts as I can author only 3 sub-parts as per my policy Given data...
Q: You'd like to test the null hypothesis that the means of the two samples (column A and column B) are...
A: Introduction: The large sample test for testing the equality of two population mean. When the samp...
Q: Let p, represent the population proportion for Country C and p2 represent the population proportion ...
A: Given that Sample sizes for country C and country D n1=1024 , n2= 1078 Level of significance =alpha...
Q: Anova: Single Factor SUMMARY Average Variance Groups 2015-2019 Black Age A 2015-2019 American Age A ...
A: Analysis of variance is used to compare the significant means between two or more than two groups. D...
Q: tration 10.28. Compile a table, showing the frequencies with which words of different numbers of let...
A:
Q: ring Info Exit polling is a popular technique used to determine the outcome of an election prior to ...
A: Given that n=500 , p=0.51 , q=1-p=1-0.51=0.49
Q: Surgical wounds heal more slowly in people who are stressed. Ten nursing students were given punctur...
A: Given that Data : 5 6 6 8 9 7 8 10 9 10 We have to find Sample Mean and Sample standard deviatio...
Q: integers x and y are relatively prime if their only common positive divisor is 1. Suppose we select ...
A: Given: Total number = 1 to 315 (315)
Q: O E Ho: P1 P2 D D. Ho: P1 2 P2 H: P <P2 H, P, SP2 H P, 2P2 ind the standardized test statistic. z= ...
A: Given that Sample sizes n1=1120 , n2=1048 Sample proportion p1^ =0.47 , p2^=0.46
Q: The joint probability distribution of two random variables, X and Y, is given in the table below. Y=...
A:
Q: Let, (4.00, 5.26, 4.84, 6.77, 5.23, 5.64, 3.84, 6.4, 3.35, 4.28) iid∼N(μ,σ2) with μ∈R and σ2 is unkn...
A:
Q: A report announced that the median sales price of new houses sold one year was $221,000, and the mea...
A: a) The median sales price of new houses sold are $221000 and the mean sales price are $273,900.
Q: For each of the following transition matrices, do the following: (1) Determine whether the Markov ch...
A: If there are more than one communication class then the markov chain is reducible. If all the states...
Q: Find the critical value za/2 that corresponds to the given confidence level. 81% Za/2 = (Round to tw...
A: The variable Z follows standard normal distribution with mean 0 and standard deviation 1
Q: ILlastration 9.19. (a) In a moderetely asymmetrical distribution. the mode and mean are 32.1 and 35....
A:
Q: ume that adults spend an average of 104.1 minutes with a standard deviation of 26.4 minutes in the R...
A: Given data,Mean μ=104.1sd σ=26.4P(60<X<90)=?
Q: hat is the possible range of values for Pearson's coefficient of skewness?
A: Here For Perason coefficient of Skewness
Q: You are given the sample mean and the population standard deviation. Use this information to constru...
A:
Q: Show your complete Solution. 1. A study of 40 bowlers showed that their average score was 186. The s...
A: Given,sample size(n)=40mean(x¯)=186standard deviation(σ)=6α=1-0.95=0.05α2=0.025Z0.025=1.96 (from ...
Q: 1. A researcher predicted that students will learn better if they attribute their performance to eff...
A: For the given data perform t test for independent sample test
Q: Use the figure to the right, which shows the percentages of adults from several countries who favor ...
A:
Kindly show the full Working Steps. Thanks!
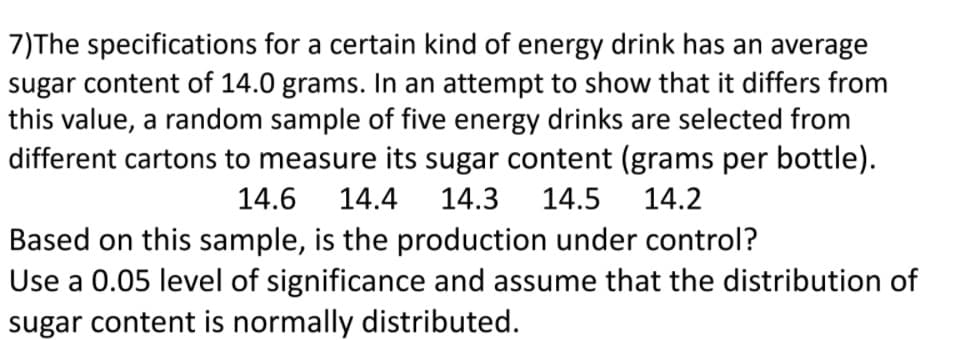
Step by step
Solved in 3 steps
- Historically, the time spent by DCSI3710 students on trying to certify any HLS homework is known to have a mean of 35 minutes. In order to examine the claim that homework 12.2 was actually more time-consuming, an instructor asked 16 students how much time they spent on it. Assume that the p-value associated with the test statistic is 0.03. At a significance level of 0.01, what is the conclusion of the hypothesis test?A well-known brokerage firm executive claimed that at least 90% of investors are currently confident of meeting their investment goals. An XYZ Investor Optimism Survey, conducted over a two week period, found that in a sample of 800 people, 88% of them said they are confident of meeting their goals. What practical conclusion can we make about the claim? What would be our formal conclusion if we used a 0.01 significance level?This chart shows the results of two random samples that measured the average number of minutes per charge for AA Lithium-ion (Li-ion) rechargeable batteries versus Nickel-Metal Hydride (NiMH) rechargeable batteries. Down below shows the hypothesis test using significance level (α) = 0.05 to determine if the true average number of minutes per charge for NiMH batteries is smaller than that for Li-ion batteries. 1. From the data given from the first graph below, what would be the correct p value? (the one tail or the two tail?) t-Test: Two-Sample Assuming Unequal Variances NiMH Li-ion Mean 89.35714 95 Variance 3.93956 59.75 Observations 14 17 Hypothesized Mean Difference 0 df 19 t Stat -2.89621 P(T<=t) one-tail 0.004628 t Critical one-tail 1.729133 P(T<=t) two-tail 0.009255 t Critical two-tail 2.093024 For the bottom graph: 1.. Find the point estimate (you can do this by subtracting Group 2…
- Many fast-food restaurants have soft drink dispensers with preset amounts, so that when the operator merely pushes a button for the desired rink the cup is automatically filled. This method apparently saves time and seems to increase worker productivity. A researcher randomly selects 9 workers from a restaurant with automatic dispensers and 9 works from a restaurant with manual dispensers. At a 1% significance level, use the Mann-Whitney U Test to test whether workers with automatic dispensers are significantly more productive. Automatic (Group 1): 153, 128, 143, 110, 152, 168, 144, 137, 118Manual (Group 2): 105, 118, 129, 114, 125, 117, 106, 92, 126 What rank will be given to the observation value, 118 that is in both the automatic and manual groups? (Round answer to 1 decimal). When rounding the U test statistic up to the next value, what is the p-value from the Mann Whitney Table of p-values? (Round to 4 decimal places)In preparation for upcoming wage negotiations with the union, the managers for the Bevel Hardware Company want to establish the time required to assemble a kitchen cabinet. A first line supervisor believes that the job should take 5555 minutes on average to complete. A random sample of 2626 cabinets has an average assembly time of 5858 minutes with a population standard deviation of 88 minutes. Is there overwhelming evidence to contradict the first line supervisor’s belief at a 0.020.02 significance level? Assume the population of assembly times is approximately normally distributed. Step 2 of 3 : Compute the value of the test statistic. Round your answer to two decimal places.A scientist selected a random sample of seven varieties of peach ice cream to investigate the relationship between the density, in pounds per cubic inch, of the varieties of ice cream and the percent concentration of peaches in the ice cream. Assuming all conditions for inference are met, which of the following significance tests should be used to investigate whether there is convincing evidence at the 0.05 level of significance that a greater percent of peaches in the ice cream is associated with an increase in the density of the ice cream? A. A two-sample t-test for a difference between means B. A chi-square test of independence C. A linear regression t-test for slope D. A two-sample z-test for a difference between proportions E. A matched pairs t-test for a mean difference
- This chart shows the results of two random samples that measured the average number of minutes per charge for AA Lithium-ion (Li-ion) rechargeable batteries versus Nickel-Metal Hydride (NiMH) rechargeable batteries. Down below shows the hypothesis test using significance level (α) = 0.05 to determine if the true average number of minutes per charge for NiMH batteries is smaller than that for Li-ion batteries. 1. From the data given what would be the correct p value? (the one tail or the two tail?) 2. Find the point estimate (you can do this by subtracting Group 2 Sample Mean from Group 1 Sample Mean.) 3. Find the Lower Bound of the confidence interval by subtracting the Margin of Error from the point estimate. 4. Find the Upper Bound by adding the margin of error to the point estimate. t-Test: Two-Sample Assuming Unequal Variances NiMH Li-ion Mean 89.35714 95 Variance 3.93956 59.75 Observations 14 17 Hypothesized Mean Difference 0 df…As a part of an industrial training program, some trainees are instructed by Method A, which isstraight teaching-machine instruction, and some are instructed by Method B, which also involvesthe personal attention of an instructor. Random samples of size 10 are taken from large groupsof trainees instructed by each of these two methods, and the scores they obtained in anappropriate achievement test are shown in Table 5. Use 0.05 level of significance to test the claimthat Method B is more effective. Assume that the populations sampled can be approximatedclosely with normal distribution having the same variance. Method A 71 75 65 69 73 66 68 71 74 68 Method B 72 77 84 78 69 70 77 73 65 75In a two-sample, one-tailed, independent t-test with a Power level of .90, effect size of .5, and an alpha level of .05, the total sample size needed for credibility and believability would be:
- A market research study hopes to determine if the average sales of house entertainment units will increase in a test market with the introduction of a new package. Sales recorded in a 32-day period for the old package and a 30-day period for the new package were as follows: What can be concluded at 2.5% significance level? Use the Ten Step Process. Level of Significance:___________________________________________________ Test Statistic:_________________________________________________________ Formula:_____________________________________________________________An author argues that more American-born baseball players have birth dates in the months immediately following July 31 because that was the age cutoff date for nonschool baseball leagues. The table below lists months of births for a sample of American-born baseball players and foreign-born baseball players. Using a 0.01 significance level, is there sufficient evidence to warrant rejection of the claim that months of births of baseball players are independent of whether they are born in America? Do the data appear to support the author's claim? Jan. Feb. March April May June July Aug. Sept. Oct. Nov. Dec. Born in America 387 328 367 343 334 312 315 502 424 434 400 371 Foreign Born 102 82 84 81 95 83 59 90 69 99 104 83 If the null and alternative hypotheses for this test are: H2: Months of births of baseball players are independent of where they are born. H1: Months of births…An author argues that more American-born baseball players have birth dates in the months immediately following July 31 because that was the age cutoff date for nonschool baseball leagues. The table below lists months of births for a sample of American-born baseball players and foreign-born baseball players. Using a 0.01 significance level, is there sufficient evidence to warrant rejection of the claim that months of births of baseball players are independent of whether they are born in America? Do the data appear to support the author's claim? a. Identify the test statistic. (Round to three decimal places as needed.) b. Identify the P-value. (Round to three decimal places as needed.)