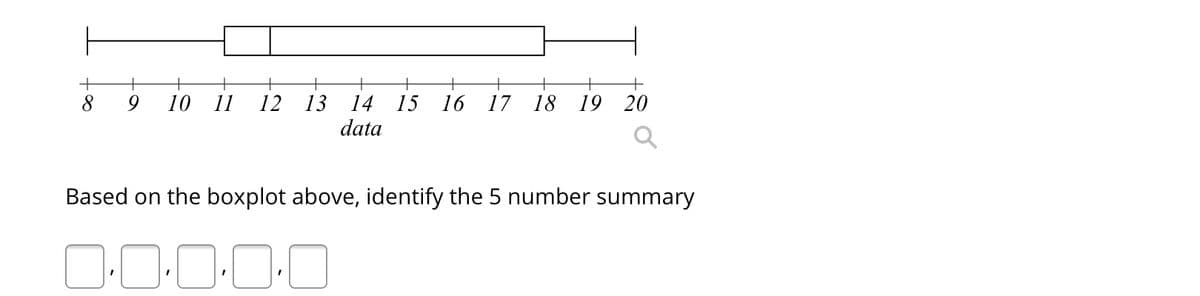
8 10 11 12 13 14 15 16 17 18 19 20 data Based on the boxplot above, identify the 5 number summary O:0-0-0-0


Q: 13 16 17 18 19 14 15 data 9. 10 11 12 Based on the boxplot above, identify the 5 number summary…
A: Explanation: The 5 number of summary are: Minimum, First quartile Q1, Median Q2, Third quartile…
Q: 9 12 16 17 26 32 32 32 32 32 37 38 What fraction of the numbers in the data set is greater than…
A:
Q: 12 13 14 15 16 data 17 18 19 Based on the boxplot above, identify the 5 number summary
A: The objective is to identify the 5 number summary based on given box plot.
Q: 10 11 12 13 14 15 16 17 18 19 data Based on the boxplot above, what is the value for the Q3?
A: A box-plot is graphical method of displaying the distribution of data based on five number summary-…
Q: Test the hypothesis at the 1% significance level Cell 1 2 3…
A: To test the hypothesis we find mean and standard deviation, Mean= Summation (fiXi)/(summation fi)…
Q: 4. Which group is the most heterogeneous? Group I scores Group II scores Group III scores 100 123…
A: Given Information: Group I Scores Group II Scores Group III Scores 100 102 150 123 102 120…
Q: 12. Compute the amount of information and the redundancy of the following data presented in the…
A:
Q: Here is a set of data. 2 26 28 90 | 503 | 520 | 522 573 683| 708 773 848 | 968 979 Identify the 5…
A: Solution: The observation in increasing order is 2, 26, 28, 90, 503, 520, 522, 573, 683, 708, 773,…
Q: b) Calculate the Mean, Median and Modal numbers of persons per house from the data: 2 3 7. 10 No. of…
A: to find mean median mode
Q: 1. Consider the following sets of data. Which data appears to have more variation? SETA 35 16 22 19…
A: Given Data set are given by Set A 35 16 22 19 23 13 17 27 9 15 Set B 15 9 56 30 3 70 2 40 51…
Q: 10 12 14 16 18 Which of the following statements are true about the boxplot shown here? I. The…
A:
Q: + 10 12 13 14 data 11 15 16 17 18 Based on the boxplot above, what is the value for the median
A: The objective is to find the value of median based on the box plot.
Q: Find the variance in classified data set (k=5) Sınıflandırilmış veriterde varyansı bulunuz (k-5) 17…
A: Given data : 17, 20, ,23, 26, 28, 31, 37, 40, 40, 40, 40, 40, 44, 49, 50, 55, 60, 63, 65, 65…
Q: 12 13 14 15 16 17 18 data Based on the boxplot above, identify the 5 number summary
A:
Q: Consider the following data set: 55 33 20 11 25 53 13 50 16 39 39 41 23 23 48 33 11 23 Below is a…
A: Given data set is: 55, 33, 20, 11, 25, 53, 13, 50, 16, 39, 39, 41, 23, 23, 48, 33, 11, 23. We have…
Q: 10 12 14 16 18 Which of the following statements are true about the boxplot shown here? I. The…
A: See the handwritten solution
Q: 15. What is the value of the mode when all values in the data set are distinct? A. Zero B. None C.…
A: Know that Mode = most frequent value of the data set.
Q: Researchers were interested in looking at air quality in different regions of the United States. The…
A: We have to find five number summary , that is, 1. Minimum Value 2. First Quartile 3. Median 4.…
Q: 4. 10 12 14 16 18 Which of the following statements are true about the boxplot shown here? I. The…
A: The distribution is skewed left since the the boxplot has longer side towards left of the median.…
Q: Consider the data summarised in the table below: Group 1 Group 2 n. 70 98 y 10.88 17.46 2.79 4.87…
A: Given that Sample Mean 1 (\bar X_1)(Yˉ1) = 10.8810.88 Sample Standard Deviation 1 (s_1)(s1)…
Q: 6. 7 8 9 10 11 12 13 14 15 16 17 18 data Based on the boxplot above, identify the 5-number summary.…
A: Introduction: The 5-number summary includes the minimum, first quartile (Q1), second quartile…
Q: Find the original data from the stemplot. Stem Leaves 6 8 1 8 10 66 89
A: A steam and leaf plot (also called as stem plot) is just another way to summarize data. Its similar…
Q: Here is a set of data. 82 87 123 233 240 256 270 402 443 474 611 616 617 781 843 853 Identify the 5…
A:
Q: On the first day of class, an economics professor administers a test to gauge the math preparedness…
A: Hello! As you have posted more than 3 sub parts, we are answering the first 3 sub-parts. In case…
Q: Identify the value of the test statistic. Source DF SS MS Factor 3. 30 10.00 16 0.264 Ernor 50 6.25…
A: In this context, the output for the One-Factor ANOVA is given. From the output, the F-test statistic…
Q: b) Calculate the Mean, Median and Modal numbers of persons per house from the data: No. of persons…
A: Mean, median, and mode are the types of average. These are measures of central tendency, which means…
Q: 10 9 8 8 8 Determine the skewness if the data given is a sample. Use 4 decimal places 7 7 5 2 1
A: Given data is 10,9,8,8,8,7,7,5,2,1
Q: + 13 14 15 16 17 18 19 data Based on the boxplot above, what is the value for the minimum Question…
A: In general boxplot shows five number summary, which are minimum, first quartile, median, third…
Q: Here is a set of sample data 8 11 23 24 29 31 53 55 65 68 80 Identify the 5 number summary (min, Q1,…
A: Solution: The observation in increasing order is 8, 11, 23, 24, 29, 31, 53, 55, 65, 68, 80. n = 11…
Q: 7. Do these two data displays match up? Explain your answer. 14 13 12 11 10 6. 10 11 12 13 14 15 16…
A:
Q: 10 12 14 16 18 20 22 Education What was the sample size used? Females (thousands)
A: A scatter diagram is a graphic plot in which two sets of data are plotted against each other, along…
Q: + 10 11 12 13 15 14 data 16 17 18 19 Based on the boxplot above, identify the 5 number summary
A:
Q: 2 10 12 14 16 18 Which of the following statements are true about the boxplot shown here? I. The…
A:
Q: The boxplot shown below results from the heights (cm) of males listed in a data set. What do the…
A: The boxplot shows the five-number summary.
Q: Consider the boxplot below. 74 18 32 45 56 20 30 40 50 60 70 80 10 data a. What quarter has the…
A:
Q: 2. What is the five statistical summary for the following box plot? 12 14 16 18 20 22 24 26 28 30 32…
A: Determine the values of the five number summary. The value of the Five number summary is…
Q: A sample of 12 small accounting firms reveals the following numbers of professionals per office. 7…
A: The coefficient of variation (CV) is a statistical measure of data points' dispersion around the…
Q: 17 18 19 14 15 16 data 10 11 12 13 20 Based on the boxplot above, identify the 5 number summary
A:
Q: 12 13 14 15 16 17 18 19 data 7. 6. 10 11 Based on the boxplot above, identify the 5 number summary…
A: The five number summary is descriptive statistics that provides information about the data set. The…
Q: You work for an insurance company and are studying the relationship between types of crashes and the…
A:
Q: 9 10 11 12 13 14 15 16 17 data 7 8 Based on the boxplot above, identify the 5 number summary
A:
Q: » v, dijg 3. 28. FILE The Department of Statistics at Western State University offers eight sections…
A: Since you have posted multiple sub-parts, we will solve the first three sub-parts for you. To get…
Q: 4. Which of the following answers best describes the table Quality 1: QUALITY 1 SUPPLIER DEFECT А В…
A:
Q: 11. Consider the following 3 data sets A 20 30 40 50 60 B. -20 -10 10 20 C -2 -1 1
A: Solution
Q: A sociologist is interested in studying the relationship between education and crime. She randomly…
A: The data shows the education level and whether or not they have ever been convicted of a felony.
Q: : 8:38. Calculate the coefficient of concurrent deviations for the following data : ww Supply 65 40…
A:
Q: 16. The data set below shows the cost of a gallon of milk in dollars in 5 different cities. Which of…
A: Given that data 2.57,4.15,3.72,1.99,6.12
Q: 12 13 14 15 16 data 17 18 19 20 Based on the boxplot above, identify the 5 number summary
A: Given, Min =12 Q1=13 Q2=18 Q3=19 Max =20
Q: 8. 9. 10 I1 12 13 14 15 16 17 18 data Based on the boxplot above, identify the 5 number summary…
A:
Q: Full data setO Name Brand Store Brand 27 20 22 26 23 16 22 20 23 24 33 31 29 33 25 27 15 20 26 21 25…
A:


Trending now
This is a popular solution!

Step by step
Solved in 2 steps with 2 images


- How many distinct rearrangements of the letters of the word DEADWOOD are there if the arrangement must begin and end with the letter D?Suppose that the check digit is computed as described in Example . Prove that transposition errors of adjacent digits will not be detected unless one of the digits is the check digit. Example Using Check Digits Many companies use check digits for security purposes or for error detection. For example, an the digit may be appended to a -bit identification number to obtain the -digit invoice number of the form where the th bit, , is the check digit, computed as . If congruence modulo is used, then the check digit for an identification number . Thus the complete correct invoice number would appear as . If the invoice number were used instead and checked, an error would be detected, since .Suppose 4- bit words abcd are mapped onto 5- bit code words abcde, where e is the parity check digit. Detect any errors in the following six-word coded message. 111010010100010111000001110100
- In how many distinguishable ways can the letters in MITOSIS be written?From a test cross you get 152 green, hairless; 23 green, hairy; 148 white, hairy, and 27 white, hairless. Calculate the chi squared to test the independent assortment hypothesis and determine if these genes assort independently.The article “A ‘White’ Name Found to Help in Job Search” (AP, 1/15/03) described an experiment to investigate if it helps to have a white-sounding first name when looking for a job. Researchers sent 5000 resumes in response to ads that appeared in the Boston Globe and Chicago Tribune. The resumes were identical except the 2500 of them had “white-sounding” first names, such as Brett and Emily, whereas the other 2500 had “black-sounding” names such as Tamika and Rasheed. Resumes of the first type elicited 300 responses and resumes of the second type only 167 responses. Does this data support the theory that the proportion receiving positive responses is higher by more than 10% for those resumes with “white-sounding” first names? Use a significance level of .05.
- suppose that from a sample of 200,000 new york workers, 32,400 reported traveling more than an hour an day. From this information, statisticians determined that about 16.2% of the workers in the state traveled more than an hou to work every day in 2011. If there were 8,437,512 workers in the entire population, about how many traveled more than an hour to work each day?find the z score in which 93.70% of the z scores in a population are below that valuethe following data represent the amount of time (in minutes) a random sample of eight sample of students enrolled in sullivians intermediate algebra course spent on homework from Section 4.5, factoring polynials 48 88 57 109 121 93 71. Determine the standard devidion and interquartile range
- The management of the local zoo wants to know if all of their animal exhibits are equally popular. If there is significant evidence that some of the exhibits are not being visited frequently enough, then changes may need to take place within the zoo. A tally of visitors is taken for each of the following animals throughout the course of a week, and the results are contained in the following table. At α=0.05, determine whether there is sufficient evidence to conclude that some exhibits are less popular than others. Animal Exhibits at the ZooElephants Lions/Tigers Giraffes Zebras Monkeys Birds ReptilesNumber of visitors 137 129 161 147 160 134 131 Step 3 of 4 : Compute the value of the test statistic. Round any intermediate calculations to at least six decimal places, and round your final answer to three decimal places. Step 4 of 4: Draw a conclusion and interpret the decision. (Reject or fail to reject, Is there enough evidence or not?)The management of the local zoo wants to know if all of their animal exhibits are equally popular. If there is significant evidence that some of the exhibits are not being visited frequently enough, then changes may need to take place within the zoo. A tally of visitors is taken for each of the following animals throughout the course of a week, and the results are contained in the following table. At α=0.05, determine whether there is sufficient evidence to conclude that some exhibits are less popular than others. Animal Exhibits at the Zoo Elephants Lions/Tigers Giraffes Zebras Monkeys Birds Reptiles Number of visitors 139 136 169 125 174 137 174 Copy Data Step 3 of 4 : Compute the value of the test statistic. Round any intermediate calculations to at least six decimal places, and round your final answer to three decimal places.would the z score for the .30 be .6480?


