Researchers were interested in looking at air quality in different regions of the United States. The following dotplot represents the number of days in a certain month that the air quality was unhealthy for eighteen cities in the Midwest. 3 6. 8. 9. 10 11 12 Days Which of the following is the boxplot for these data? (A) 1 3 4 5. 8. 10 11 12 Number of Unhealthy Days (B) 10 11 12 Numbe
Researchers were interested in looking at air quality in different regions of the United States. The following dotplot represents the number of days in a certain month that the air quality was unhealthy for eighteen cities in the Midwest. 3 6. 8. 9. 10 11 12 Days Which of the following is the boxplot for these data? (A) 1 3 4 5. 8. 10 11 12 Number of Unhealthy Days (B) 10 11 12 Numbe

Glencoe Algebra 1, Student Edition, 9780079039897, 0079039898, 2018
18th Edition
ISBN:9780079039897
Author:Carter
Publisher:Carter
Chapter10: Statistics
Section10.6: Summarizing Categorical Data
Problem 27PPS

Related questions
Topic Video
Question

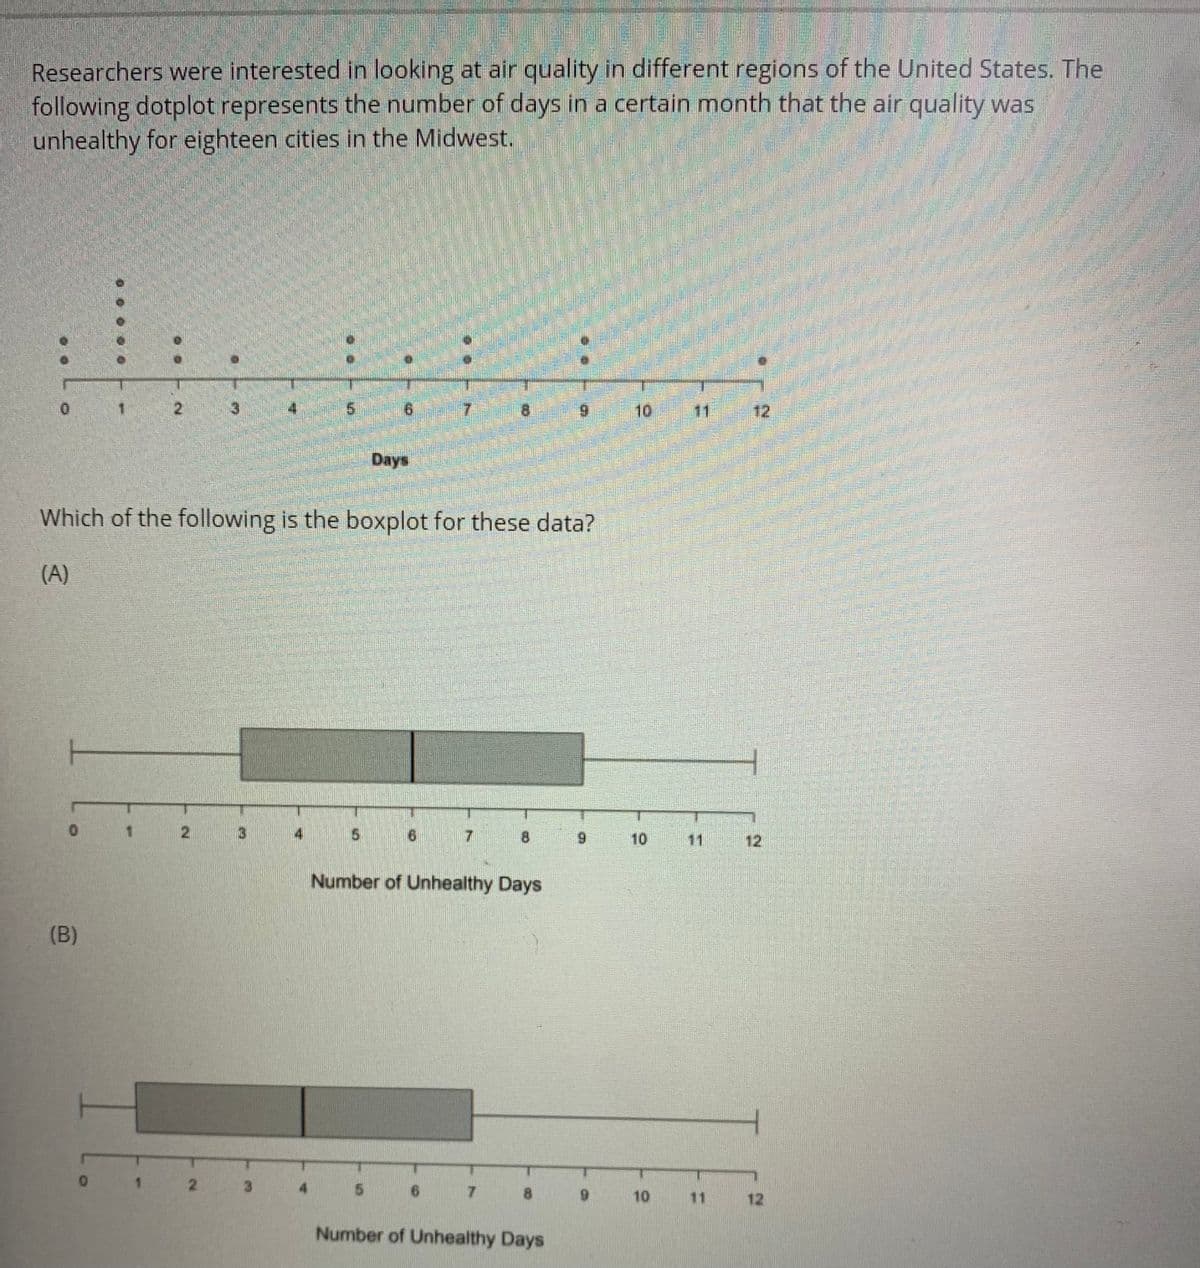
Transcribed Image Text:Researchers were interested in looking at air quality in different regions of the United States. The
following dotplot represents the number of days in a certain month that the air quality was
unhealthy for eighteen cities in the Midwest.
1 2
6 7
10
11 12
Days
Which of the following is the boxplot for these data?
(A)
1.
2.
10
11
Number of Unhealthy Days
(B)
3
4
8.
6.
10
11
12
Number of Unhealthy Days
12
9.
Expert Solution
This question has been solved!
Explore an expertly crafted, step-by-step solution for a thorough understanding of key concepts.

This is a popular solution!

Trending now
This is a popular solution!

Step by step
Solved in 2 steps with 1 images

Knowledge Booster


Learn more about
Need a deep-dive on the concept behind this application? Look no further. Learn more about this topic, statistics and related others by exploring similar questions and additional content below.Recommended textbooks for you
Glencoe Algebra 1, Student Edition, 9780079039897…
Algebra
ISBN:
9780079039897
Author:
Carter
Publisher:
McGraw Hill
Glencoe Algebra 1, Student Edition, 9780079039897…
Algebra
ISBN:
9780079039897
Author:
Carter
Publisher:
McGraw Hill