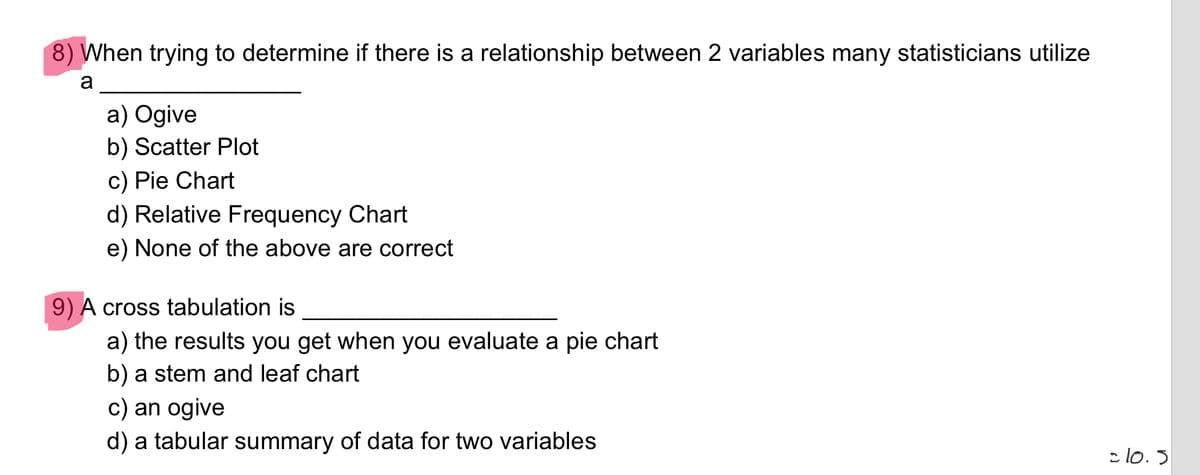
8) When trying to determine if there is a relationship between 2 variables many statisticians utilize a a) Ogive b) Scatter Plot c) Pie Chart d) Relative Frequency Chart e) None of the above are correct 9) A cross tabulation is a) the results you get when you evaluate a pie chart b) a stem and leaf chart c) an ogive d) a tabular summary of data for two variables clo. 3


Q: 7. A manner of collecting data by asking the participants questic indirectly. O A. Questionnaire O…
A: Types of Data collection methods: 1)Physiological or biological measurements 2)Observational…
Q: A researcher would like to know whether there is a consistent, predictable relationship between…
A:
Q: The respective observed frequencies are written in the cells of the contingency table below. In…
A: The expected frequency can be calculated as E = (row total × column total)/Grand total
Q: The boxplot shown below results from the heights (cm) of males listed in a data set. What do the…
A: Introduction:
Q: Is the transportation mode used to ship goods independent of type of industry? Suppose the following…
A: The null and alternative hypotheses for the test are: H0: Transportation mode used to ship goods…
Q: The following table shows the frequency of outcomes when two distinguishable coins were tossed 4,000…
A: Given data, Outcome Frequency HH 1100 HT 950 TH 1400 TT 550 Relative frequency=?
Q: 8. A group of 300 students were classified as follows General science 120 General arts Visual arts…
A: Given, Total Students 300 They are classified as follows, General Science 120 General Arts 90…
Q: A researcher would like to know whether there is a consistent, predictable relationship between…
A: Given : VERBAL SKILLS MATH SKILLS HIGH LOW HIGH 59 41…
Q: Consider the following numbers: 2 3 4 5 5 (a) Compute the mode, median, and mean. mode median mean…
A: According to the answering guidelines, we can answer only three subparts of a question and the rest…
Q: An elementary school principal randomly selected students and asked what their favorite color was.…
A: We need to create frequency table by categories of color
Q: The following table shows the frequency of outcomes when two distinguishable coins were tossed 4,000…
A: Question is solved.
Q: In environmental studies, sex ratios are of great importance. Wolf society, packs, and ecology have…
A: (a) From the information given, there is a 5% level of significance. Thus, the level of significance…
Q: A doctor wanted to determine whether there was a relation between a male's age and his HDL…
A: The following points are used to study the correlation between two variables X and Y by the scatter…
Q: The following summary appears in a report on a survey covering 1,000 fields. Find out if the data…
A:
Q: The following table shows the profile of patients inflicted by the pandemic disease. Create a…
A: Relative frequency table: PHStat Procedure: In EXCEL, Select Add-Ins > PHStat > Descriptive…
Q: ip between salary and expenditure of the private sector male employees in Ibri. Which of the…
A: The population is known as the set of all the possible observations about a specified characteristic…
Q: 8. Calculate the relative frequencies of the tree types. 10 A re betweon 4.8 and commun panimet udy…
A:
Q: In some states, a driver of a vehicle may not use a handheld cell phone whlle driving. In one state…
A: Answer
Q: II. Explain which of the following constitute a population and which constitute a sample. The…
A: Population: A population is the pool of individuals from which a statistical sample is drawn for a…
Q: 13 association bet ween the tempers of brothers and Do you find sisters from the following data: any…
A:
Q: A report on airline quality included the data for 13 U.S. airlines given in the table below. On-Time…
A:
Q: 8) A company manager wishes to test a union leader'sc different week days with the same frequencies.…
A: We will do a Chi-square test for this
Q: In a trial of a new allergy medicine, 55 people were given the medicine and 55 were given a placebo.…
A: Solution:Given data is :* Number of people were given the medicine = 55* Number of people were given…
Q: 13. Mulvihill, Obuseh, and Caldwell (2008) conducted a survey evaluating healthcare providers’…
A:
Q: a. Construct a Venn diagram Representation to organize the given data. b. How many liked rock music…
A: Here define events Classical music = C Rock music = R Light Opera = L Here AS PER POLICY I HAVE…
Q: A report included data from a study in which 790 people in a representative sample of college…
A: The hypothesis is, Null hypothesis: H0: There is no an .association between age and perception of…
Q: Consider the test scores of 30 students in an exam and construct a FDT with 5 classes showing the…
A: Histogram are used to represent the continuous data with categories. It helps to understand the…
Q: Thirty-fourcities were researched to determine whether they had a professional sports team, a…
A: Consider that event P defines that the city had professional sports team, event S defines that the…
Q: ) A marketing survey of consumers' soft-drink preferences collected the following data: • 75 liked…
A: Let us denote:C=cola, G=ginger ale, S=spring waterGiven that:n(C)=75, n(G)=65,…
Q: Which age groups are being compared for contrast 1? 30 to 39 year olds and 40 to 49 year olds 40 to…
A: The t-test output with ANOVA and descriptive for the 4 age groups are given.
Q: In some states, a driver of a vehicle may not use a handheld cell phone whlle driving. In one state…
A:
Q: 2. The VP for Academic Affairs of UPang wished to understand the distribution of students in the…
A:
Q: Can you help me work out #1 and #2?
A: This table shows regionwise ethnic segregation.
Q: The results of a survey of 39 students and the forelgn language they are studylng are shown In the…
A: Consider the table
Q: 7. A survey among the workers in a large manufacturing company was taken, in order to find out from…
A:
Q: 1. What is the branch of mathematics that deals with the colecion, organization, presentation,…
A: As per the guidelines we can solve 3 problems only.
Q: 9.12 A group of students are classified by their residential origin and full attention to learning:…
A: Solution: 9.12 The given table of data is
Q: To investigate the association between eye-colour of husband and eye- colour of wife, the following…
A: Solution:
Q: Two thousand frequent business travelers were asked which Midwestern city they prefer: Indianapolis,…
A: Given Information: Total business Travelers = 2000 Travelers who like Indianopolis best = 100…
Q: A researcher would like to kno w whether there is a consistent, predictable relationship between…
A: Given: A researcher would like to know whether there is a consistent, predictable relationship…
Q: Each of eighty-four middle school students was asked, "What is your favorite subject?" Here are the…
A: Girls Boys Social Studies 15…
Q: Suppose that a difference between two groups mean is examined. In the language of statistics, the…
A: Given, Suppose the difference between two groups mean is examined.
Q: A fitness magazine surveyed a group of young adults regarding their exercise programs and the…
A: The results obtained from the fitness magazine surveyed a group of young adults regarding their…
Q: Create a two-way frequency table for the given information collected from a random group of high…
A: Two way frequency table: A two way table is a way to display frequencies or relative frequencies for…
Q: 1. Select 10 students currently enrolled at your college and collect data for these three variables:…
A: We are asked to collect data for the following variables:- X:- number of courses enrolled in Y:-…
Q: A recent poll revealed the political affiliations of 205 Americans, along with the region of the…
A: Introduction: The null and alternative hypotheses for the test would be: H0: Political affiliation…
Q: A sample of 400 Goshen households is selected and several variables are recorded. Which of the…
A: Given that : A sample of 400 Goshen households is selected and several variables are recorded.
Q: The arm span and foot length were measured (in Using the computer output, what is the predicted foot…
A:
Q: In some states, a driver of a vehicle may not use a handheld cell phone whlle driving. In one state…
A: The relative frequency of drivers who knows and obeys the law is determined as shown below


Trending now
This is a popular solution!

Step by step
Solved in 2 steps


- 1.List the advantages and disadvantages of using relative frequencies in place of frequencies, in constructing histograms and frequency polygons ? 2.consider a research from any feild and classify the variables as descrete or countinous? 3.Describe a binary odinal variable from any area of researchDevelop two research hypotheses: (a) one that would be used to examine differences between two unrelated groups and (b) one that would examine differences between two dependent groups.Psychologist Bernie Silverman of Michigan State University tested the effect of astrological compatibility on marriages. In studying 2,978 marriage records and 478 corresponding divorce records in Michigan, Dr. Silverman found couples whose marriges were made in horoscope heaven united and split up just as frequently as those who were not astrologically compatible. He concluded that astrological compatibility did not have an effect on marriage success. Identify the population.
- If a study determines the difference in average salary for subpopulations of people with blue eyes and people with brown eyes is not signaficant, then the populations of blue eyed people and brown eyed people are _______ different salaries... unlikey to have very likely to have guranteed to have guranteed to not haveA researcher would like to know whether there is a consistent, predictable relationship between verbal skills and math skills for high school students. A sample of 200 students is obtained, and each student is given a standardized English test and a standardized math test. Based on the test results, students are classified as high or low for verbal skills and for math skills. The results are summarized in the following frequency distribution: Verbal Skills High Low High Math 59 41 Low Math 31 69 Based on these results, can the researcher conclude that there is a significant relationship between verbal skills and math skills? Test at the .05 level of significance. Compute the phi-coefficient to measure the strength of the relationship.A researcher would like to know whether there is a consistent, predictable relationship between verbal skills and math skills for high school students. A sample of 200 students is obtained, and each student is given a standardized English test and a standardized math test. Based on the test results, students are classified as high or low for verbal skills and for math skills. The results are summarized in the following frequency distribution: Verbal Skills High Low High Math 59 41 Low Math 31 69 Based on these results, should the researcher conclude that there is a significant relationship between verbal skills and math skills? Use α = .05. Compute the phi-coefficient to measure the strength of the relationship.
- Consider the following numbers: 2 3 4 5 5 (a) Compute the mode, median, and mean.mode median mean (b) If the numbers represented codes for the colors of T-shirts ordered from a catalog, which average(s) would make sense? (Select all that apply.)modemedianmean (c) If the numbers represented one-way mileages for trails to different lakes, which average(s) would make sense? (Select all that apply.)modemedianmean (d) Suppose the numbers represent survey responses from 1 to 5, with 1 = disagree strongly, 2 = disagree, 3 = agree, 4 = agree strongly, and 5 = agree very strongly. Which average(s) make sense? (Select all that apply.)modemedianmeanA researcher wished to find out whether the perceptions of a persons height depends on that person’s perceived status. A random sample of army inductees was selected and equally divided into four groups. An actor gave a short address to each group separately, extollng the joys of army life. For the first group, the actor was dressed as a private; for the second, as a sergeant; for the third, as a captain, and, finally, for the fourth grup, as a Colonel. The inductees were asked to fill out a questionnaire evaluating the speech. Among the questions was one asking for an estimate of the lecturer’s height.A researcher would like to know whether there is a consistent, predictable relationship between verbal skills and math skills for high school students. A sample of 200 students is obtained and each student is given a standardized English test and a standardized math test. Based on the test results, students are classified as high or low for verbal skills and for math skills. The results are summarized in the following frequency distribution: HIGH Verbal LOW Verbal HIGH Math 59 41 LOW Math 31 69 a. Based on these results, can the researcher conclude that there is a significant relationship between verbal skills and math skills? Detail all four steps of your hypothesis test, α = .05. b. Compute the phi coefficient (ϕ) to measure the strength of the relationship. c. Write a sentence summarizing your results.
- An article reported the estimated percentage of U.S. households with only wireless phone service (no landline) for the 50 states and the District of Columbia. In the accompanying data table, each state was also classified into one of three geographical regions—West (W), Middle states (M), and East (E). Wireless % Region State Wireless % Region State 43.4 M AL 40.9 W MT 39.6 W AK 46.6 M NE 49.3 W AZ 48.5 W NV 56.2 M AR 43.5 M ND 42.9 W CA 31.2 E NH 50.5 W CO 25.2 E NJ 26.8 E CT 46.9 W NM 29.4 E DE 31.1 E NY 49.7 E DC 42.8 E NC 47.7 E FL 45.8 E OH 45.9 E GA 50.5 M OK 38.4 W HI 47.1 W OR 56.1 W ID 30.0 E PA 45.8 M IL 34.7 E RI 47.6 M IN 49.6 E SC 50.8 M IA 41.4 M SD 51.5 M KA 46.6 M TN 47.1 M KY 54.6 M TX 40.8 M LA 52.1 W UT 40.7 E ME 41.0 E VA 36.1 E MD 37.1 E VT 31.5 E MA 48.4 W WA 47.7 M MI 37.2 E WV 43.0 M MN 46.5 M WI 55.1 M MS 51.8 W WY 51.6 M MO (a) Construct a comparative boxplot that makes it possible to compare…A survey was taken at a nursing home regarding preferences in music and it was found that: 12 listen to western 11 listen to classical 14 listen to jazz 8 listen to western and jazz 9 listen to jazz and classical, 5 listen to western and classical 8 listen to none of these 3 listen to all three. How many people were surveyed?A researcher would like to know whether there is a consistent, predictable relationship between verbal skills and math skills for high school students. A sample of 200 students is obtained and each student is given a standardized English test and a standardized math test. Based on the test results, students are classified as high or low for verbal skills and for math skills. The results are summarized in the following frequency distribution: High verbal skills Low verbal skills High Math skill 50 30 Low Math skill 50 70 Based on these results, can the researcher conclude that there is a significant relationship between verbal skills and math skills? Test at the .05 level of significance.ii. Compute the phi-coefficient and evaluate the strength of the relationship.