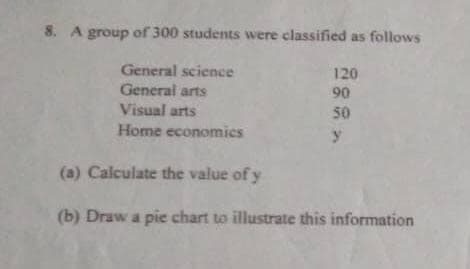
8. A group of 300 students were classified as follows General science 120 General arts Visual arts 90 50 Home economics (a) Calculate the value of y (b) Draw a pie chart to illustrate this information


Q: Assuming that the population variances from both offices are not equal, is there evidence of a…
A: Let sample 1 for Central Office I Time and sample 2 Central Office II Time. Given: n1 = 20, n2 = 20…
Q: Find range for the following data: Classes 62-64 64-66 66-68 68-70 70-72 Frequency Solution: 5 3 4 5…
A: Find range for the following data: Classes 62-64 64-66 66-68 68-70 70-72 Frequency Solution: 5 3 4 5…
Q: Please see question attached.
A: From given data, Total no of people= 118752 No of persons who are male and age is between 25-34 is…
Q: Construct the frequency polygon for the following: Table 2.45 Tar (mg) in Nonfiltered Cigarettes…
A:
Q: Table 10-2 A problem with a phone line that prevents a customer from receiving or making calls…
A: The given information is, Central Office I Time to Clear Problems (minutes) 1.48 1.75 0.78 2.85 0.52…
Q: 8. The following Table gives the millions of metric tons of carbon dioxide (CO2) emissions from…
A: Note: Hi there! thank you for posting the question. As there are multiple sub parts, according to…
Q: Example 4-17. Draw a pie diagram to represent the following data of proposed expenditure by a State…
A: The data of proposed expenditure by state government for the year 1997-98 is given as: Items…
Q: 8 The following are the number of minutes it takes 10 typists to finish a piece of secretarial work…
A: Scatter plot: A Scatter plot is a non-mathematical representation of data, that shows the degree of…
Q: QUESTION 2 Solve the problem. Using the information in the table on home sale prices in the city of…
A:
Q: 4. A used car dealer wants to determine the relationship between the milag thousand miles) and the…
A: “Since you have posted a question with multiple sub-parts, we will solve first three sub-parts for…
Q: 2. The table below outlines educational attainment amongst newly recruited NUL employees in the…
A: A frequency table is given : With the help of this table firstly make pie chart then interpret it...…
Q: The following stem-and-leaf diagrams refer to the datafile 'Cereals' in Chapter 1. They are the…
A: A stem and leaf is a table used to display data. The 'stem' is on the left displays the first digit…
Q: Questions 1-5 refer to the small group of data shown below. X Y 4 3 2 2 0 7 4 5 6 2…
A:
Q: 10 8- 6 4 0- Salary Frequency 12 25,000 27,500 30,000 32,500 35,000 37,500 40,000
A: Type of skewness: Symmetric: If the distribution is said to be symmetric if the shape of the…
Q: 4.40 The numbers of cars failing an emissions test on randomly selected days at a state inspec- tion…
A: Probability distribution of y is given in the table below:- Y 0 1 2 3 4 5 6 7 8 9 10 P (Y)…
Q: 11.18 A company that manages four hotels wants to compare the quality of service provided in them.…
A: The ANOVA is used to compare the more than two population group means. While, the ANOVA is works…
Q: 1. Present the information in the tables in a graphical form. Choose an appropriate type of graph to…
A: The given data of findings is the categorical data, where the variable-findings is categorized into…
Q: VExample 9. Convert the following link relative into price relatives taking 1985 as otse: Year: 1997…
A:
Q: The table showing the stock price changes for a sample of 12 companies on a day is contained in the…
A:
Q: Graph Input Tool Market for Research Assistants 18 IWage (Dollars per hour) 4 16 Supply Labor…
A: *answer:
Q: 6. 10 11 12 15 data 13 14 16 17 18 19 Based on the boxplot above, identify the 5 number summary…
A: According to the given information, we have The boxplot is given.
Q: The following shows approximations of the leading causes of death among men ages 25-44 years. The…
A: Hi! Thank you for the question, As per the honour code, we are allowed to answer three sub-parts at…
Q: Consider the following two figures. Japanese Yen per 1 US Dollar Graph Danish Krone per 1 Euro Graph…
A: given solution: option c is the answer: Considering the figures above of the exchange rate regimes,…
Q: A problem with a phone line that prevents a customer from receiving or making calls is upsetting to…
A:
Q: :4:18. Draw a pie diagram to represent the following data of proposed expenditure hy a State…
A:
Q: Table 3.2 lists the total philanthropic givings (in million dollars) by six companies during 2007.…
A:
Q: 1. The following data represent the estimated number (in millions) of computers connected to the…
A: Use the Excel and Draw the Horizontal bar graph Followings are the Steps to draw the bar graph 1)…
Q: 1 8. Point out the mistakes in the following table drawn to show the distribution of population,…
A: Given data: Point out the mistakes in the following table drawn to show the distribution of…
Q: 4. In water-resources engineering, the sizing of reservoirs depends on accurate estimates of water…
A: Data ploting
Q: The table below shows the result of a survey of 175 people that asked their age and the type of…
A: The given table is: Age Group 18-25 26-35 36-45 46-64 65 and up Total Beach 20…
Q: Which of the following statements are correct? A. In general, a stem-and-leaf display based on…
A: (A). There is no boundary to take any specific numbers of Observations. (B). As x1,X2...xn is a data…
Q: 6.1.6 The following dotplot gives the ages of 21 male rat- tlesnakes. Which of the following would…
A: Data visualization is the process of denoting the numerical data visually. Data visualization can be…
Q: Here are the countries of the top 15 men that raced in a marathon. Use the data to complete parts…
A:
Q: 12. Gaucher, Friesen, and Kay (2010) found that masculine-themed words (such as competitive,…
A: To perform a comparison of metric values across different subgroups of data a bar chart can be…
Q: 3. The following table gives home values of 10 homes in three neighborhoods: Neighborhood A $800,000…
A: The Law of Iterated Expectation states that: E(X) =…
Q: 1. The number of heart patients diagnosed in each of seven leading cities in the Philippines in 1992…
A: Pie chart is the type of graph that used to represent one variable with different levels. It also…
Q: This graph shows GDP per capita for West and East Germany, Japan and Spain between 1950 and 1990.…
A:
Q: 7. If the minimum value of data equal 10 and maximum value of data equal 50 and the number of class…
A:
Q: 12. The following table gives the quantity of cement in thousands of tonnes mamuferctured each year…
A:
Q: The frequency table is provided below for reference. River Bann Blackwater Erne Shannon Barrow No.…
A: According to the descending order of Frequency we can complete the following table. Or we can see…
Q: 1. Below are the results of 30 sixth-grade I.Q. scores. 92 95 97 100 102 106 93 95 98 100 97 108 103…
A: Graphical representation refers to the use of charts and graphs to visually display, analyze,…
Q: 8) The following gives the national percentages of adults in a given age group. Use Google Sheets or…
A: 8) Given data: Age group 18 - 29 30 - 44 45 - 59 60 or older Percentage 17 27 25 31
Q: Refer to the comparison line graph which shows how the net worth of Claire Kozar's retirement…
A: Consider the graph provided in question. The graph represents the retirement savings at different…
Q: Enter the following table into your calculator or the Desmos Grapher and create the scatterplot. 2…
A:
Q: What's happening to the planet's 6.9 billion people today? A very partial answer is provided by the…
A: A bar chart denoting the various activates in the world in one day. The work done is taken on the…
Q: 6. Consider the table below on children's eating habits Percentage of 4-6-Year-Olds Meeting the…
A: The given pie chart explains the percentage of different food items that should be included in the…
Q: For each problem, write which test you used in your calculator, draw the graph, calculate pvalue,…
A: Given, Mars Inc., makers of M&M candies, claims that they produce M&Ms with the following…
Q: 2 of 47 > Five strains of the Staphylococcus aureus bacteria were grown for 24 hours either at 35…
A: The question is about correlation coefficient property Given :
Q: and placements for a wide range of
A: Given, Ad-Board, Inc. handles radio and television promotional jobs and placements for a wide range…
Q: 12. Which of these areas is a minor sector?
A: A sector is a portion that is bounded by two radii and an arc. The smaller portion is called a minor…
8-ATTCHED

Step by step
Solved in 4 steps with 1 images

- The following table shows a data set containing information for 25 of the shadow stocks tracked by the American Association of Individual Investors. Shadow stocks are common stocks of smaller companies that are not closely followed by Wall Street analysts. How many variables are in the data set? Which of the variables are categorical and which are quantitative? For the Exchange variable, show the frequency and the percent frequency for AMEX, NYSE, and OTC. Construct a bar graph similar to Figure 1.4 (in the textbook) for the Exchange variable. Show the frequency distribution for the Gross Profit Margin using he five intervals: 0 – 14.9, 15 – 29.9, 30 – 44.9, 45 – 59.9, and 60 – 74.9. Construct a histogram similar to Figure 1.5 (in the textbook). What is the average price/earnings ratio? DATA SET FOR 25 SHADOW STOCKS Company Exchange Ticker Symbol Market Cap ($ millions) Price/ Earnings Ratio Gross Profit Margin (%) DeWolfe Companies AMEX DWL 36.4…1. A recent survey of INTO Newcastle University students showed that 65% own aniPhone, 75% have a Casio fx-83 calculator and 10% have neither.a. Find the percentage of students who have both an iPhone and a calculator. b. In the space below, draw a Venn Diagram to represent this information.a) A C-chart is to be constructed for the count of surface defects in 2000 square meters of 40-kg Kraft paper. If 55 lots had a total of 550 defects. Determine the trial central line and control limits.b) An (np) chart is to be established on a painting process that is in statistical control. If 60 pieces are to be inspected every 3 hours and the fraction non-conforming is 0.06, determine the central line and control limits
- If a study determines the difference in average salary for subpopulations of mechanical engineers and civil engineers is NOT significant, then the subpopulations of mechanical and civil engineers are ________ different salaries. Guaranteed not to be earning 2.Earning very 3.Definitely earning 4.0Not earningThe scale characterized by the classification of events, objects, or persons into mutually exclusive categories and whose only mathematical relationship are those of equivalence and nonequivalence is called:1.The head of the production department of a RM Electronic Company wants to determine the relationship between the number of workers who assemble the product and the number of units assembled per day. How many workers is needed to produce 1000 units per day?
- 11.1 The table showing the stock price changes for a sample of 12 companies on a day is contained in the Excel Online file below. Construct a spreadsheet to answer the following questions. Company Price Change ($) Aflac 0.79 Bank of Am. 1.44 Cablevision -0.05 Diageo 0.93 Fluor Cp 0.42 Goodrich 0.20 John.&John. 1.33 Loews Cp 0.98 Nokia 2.36 SmpraEngy 0.51 Sunoco 0.29 Tyson Food 0.13 Open spreadsheet a. Compute the sample variance for the daily price change (to 4 decimals). b. Compute the sample standard deviation for the price change (to 4 decimals). c. Provide 95% confidence interval estimates of the population variance (to 4 decimals). _____<=Sigma^2<=______ d. Provide 95% confidence interval estimates of the population standard deviation (to 4 decimals). _____<=Sigma<=______Consider the market depicted in the graph and assume the government imposes a price floor of P2. At P2, 150 units of the good are supplied (wish to be sold) and 50 units of the good are demanded (wish to be bought). Choose the correct ones: Without an enforcement mechanism, the effect of a binding price floor will be negligible because it will simply be ignored because buyers and sellers enrich themselves by trading below the floor price. With an enforcement mechanism, the effect of a binding price floor may still be negligible if the enforcement mechanism is easy to evade or doesn't impose a significant penalty for selling below the price floor. Without an enforcement mechanism, the effect of a binding price floor will be negligible because it will simply be ignored because buyers and sellers enrich themselves by trading above the floor price. With an enforcement mechanism, the effect of a binding price floor may still be negligible if the enforcement mechanism is easy to evade or…3.6 With the increase in the mobility of the population in the United States and with the increasein home-based employment, there is an inclination to assume that the personal income in theUnited States will become fairly uniform across the country. The following table provides the percapita personal income for each of the 50 states and the District of Columbia.Income(thousands of dollars) Number of States22.0–24.9 525.0–27 .9 1328.0–30.9 1631.0–33.9 934.0–36.9 437 .0–39.9 240.0–42.9 2 Total 51 a. Construct a relative frequency histogram for the income data.b. Describe the shape of the histogram using the standard terminology ofhistograms.c. Would you describe per capita income as being fairly homogenous across…
- 1. The shares of the U.S. automobile market held in 1990 by General Motors, Japanese manufacturers, Ford, Chrysler, and other manufacturers were, respectively, 37%, 20%, 22%, 12%, and 9%. Suppose that a new survey of 1,000 new-car buyers shows the following purchase frequencies:6.6 The Department of Natural Resources (DNR) received a complaint from recreational fish- ermen that a community was releasing sewage into the river where they fished. These types of releases lower the level of dissolved oxygen in the river and hence cause damage to the fish resid- ing in the river. An inspector from the DNR designs a study to investigate the fishermen’s claim. Fifteen water samples are selected at locations on the river upstream from the community and fifteen samples are selected downstream from the community. The dissolved oxygen readings in parts per million (ppm) are given in the following table. Upstream 5.2 4.8 5.1 5.0 4.9 4.8 5.0 4.7 4.7 5.0 4.6 5.2 5.0 4.9 4.7 Downstream 3.2 3.4 3.7 3.9 3.6 3.8 3.9 3.6 4.1 3.3 4.5 3.7 3.9 3.8 3.7 a. In order for the discharge to have an impact on fish health, there needs to be at least an .5 ppm reduction in the dissolved oxygen. Do the data provide sufficient evidence that there is a large enough reduction in the mean…A company that sells digital devices has its stores in several cities in Albania. The Marketing Manager plans to transmite an advertisement for the digital camera product on local television and watch sales of that product, to see the link that exists with the number of ads transmitted and product sales. After two days, the results were presented in the following table: City Trasmitted Sales(in 000 Euro) Durrës 4 15 Sarandë 2 8 Fier 5 21 Berat 6 24 Lezhë 3 17 S S = 1.58 S = 6.1 a) What is the dependent variable?b) Construct the scatterdiagram of this connection.c) Calculate the coefficient of variation and the coefficient of determination.d) Interpret the relationship between two variables.e) What is the equation that connects these two variables? Explain the values for a and b.f) What is the expected level of sales if 10 ads are trasmitted


