8. Assume the economy is currently in equilibrium at its full-employment level of output, the money market is in equilibrium, and the MPC = 0.75. a. Suppose there is an increase in government spending that causes aggregate demand to increase by $16 billion. Show the increase in aggregate demand on the graph. Instructions: Use the tool provided "Aggregate Demand" to plot the new aggregate demand curve. Use the tool provided "New GDP" to plot the new equilibrium. AD and AS Model 200 Tools LRAS 180 AS 160 Aggregate Dei New GDP 140 120 100 80 60 AD 40 20 16 32 48 64 80 96 112 128 144 160 Real GDP (billions of dollars) Now suppose the Federal Reserve wants to keep inflation from hurting the economy and maintain output at the full-employment level. Price Level
8. Assume the economy is currently in equilibrium at its full-employment level of output, the money market is in equilibrium, and the MPC = 0.75. a. Suppose there is an increase in government spending that causes aggregate demand to increase by $16 billion. Show the increase in aggregate demand on the graph. Instructions: Use the tool provided "Aggregate Demand" to plot the new aggregate demand curve. Use the tool provided "New GDP" to plot the new equilibrium. AD and AS Model 200 Tools LRAS 180 AS 160 Aggregate Dei New GDP 140 120 100 80 60 AD 40 20 16 32 48 64 80 96 112 128 144 160 Real GDP (billions of dollars) Now suppose the Federal Reserve wants to keep inflation from hurting the economy and maintain output at the full-employment level. Price Level

Chapter10: Bringing In The Supply Side: Unemployment And Inflation?
Section: Chapter Questions
Problem 4TY

Related questions
Question
Transcribed Image Text:3/25/22, 8:59 PM
Assignment Print View
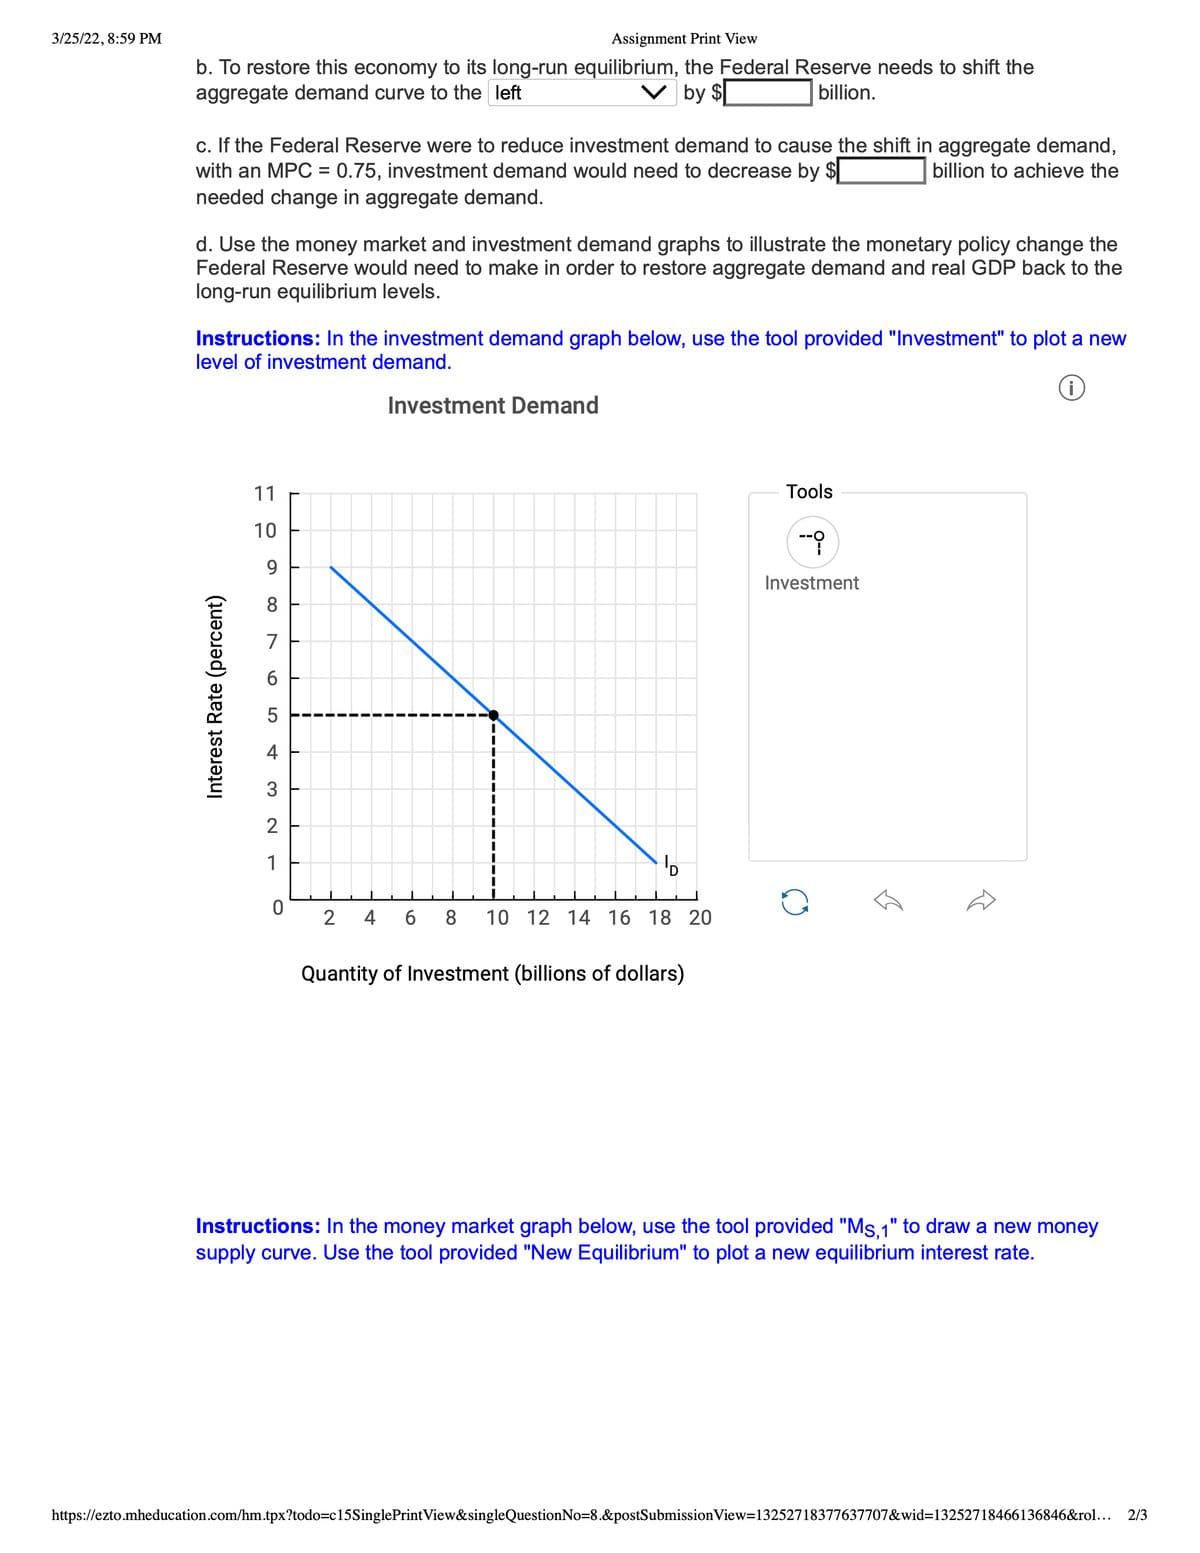
b. To restore this economy to its long-run equilibrium, the Federal Reserve needs to shift the
aggregate demand curve to the left
V by $
billion.
c. If the Federal Reserve were to reduce investment demand to cause the shift in aggregate demand,
with an MPC = 0.75, investment demand would need to decrease by
needed change in aggregate demand.
billion to achieve the
%3D
d. Use the money market and investment demand graphs to illustrate the monetary policy change the
Federal Reserve would need to make in order to restore aggregate demand and real GDP back to the
long-run equilibrium levels.
Instructions: In the investment demand graph below, use the tool provided "Investment" to plot a new
level of investment demand.
Investment Demand
11
Tools
10
--
Investment
8.
7
5
4
3
1
2
4
6.
8
10 12 14 16 18 20
Quantity of Investment (billions of dollars)
Instructions: In the money market graph below, use the tool provided "Ms,1" to draw a new money
supply curve. Use the tool provided "New Equilibrium" to plot a new equilibrium interest rate.
https://ezto.mheducation.com/hm.tpx?todo=c15SinglePrintView&singleQuestionNo=8.&postSubmission View=13252718377637707&wid=13252718466136846&rol... 2/3
Interest Rate (percent)
LO

Transcribed Image Text:3/25/22, 8:59 PM
Assignment Print View
8.
Assume the economy is currently in equilibrium at its full-employment level of output, the money
market is in equilibrium, and the MPC = 0.75.
a. Suppose there is an increase in government spending that causes aggregate demand to increase
by $16 billion. Show the increase in aggregate demand on the graph.
Instructions: Use the tool provided "Aggregate Demand" to plot the new aggregate demand curve.
Use the tool provided "New GDP" to plot the new equilibrium.
AD and AS Model
200
Tools
LRAS
180
AS
160
Aggregate Dei New GDP
140
120
100
80
60
AD
40
20
16 32 48 64 80 96 112 128 144 160
Real GDP (billions of dollars)
Now suppose the Federal Reserve wants to keep inflation from hurting the economy and maintain
output at the full-employment level.
https://ezto.mheducation.com/hm.tpx?todo=c15SinglePrintView&singleQuestionNo=8.&postSubmissionView=13252718377637707&wid=13252718466136846&rol...
1/3
Price Level
Expert Solution
This question has been solved!
Explore an expertly crafted, step-by-step solution for a thorough understanding of key concepts.

This is a popular solution!

Trending now
This is a popular solution!

Step by step
Solved in 2 steps with 1 images

Knowledge Booster


Learn more about
Need a deep-dive on the concept behind this application? Look no further. Learn more about this topic, economics and related others by exploring similar questions and additional content below.Recommended textbooks for you