8. Below are the test scores for a Biology Test: 81 77 63 92 97 68 72 a) Create a histogram of the data provided above. 88 78 96 85 66 95 70 (Use the scale: 50-60, 60 -70... to create your table for graphing 80 99 63 58 93 75 83 89 94 92 85 76 87 -> 90 b) Create a Stem Plot for the data Stem Leaves 1090-100 33 68 70 2567 801355789 9 022345679 c) Describe its main features,: Shape: ued to the left. Peaks: Hutuaons whe att a0-10015the peeacC. Spread: Dtlu Sphead of the doa. Center: udiant teManeCentral datafur tawed obta. par leff from the hiyam sanoutier 8Uau 58, is an autlicer. Outlier. (c) Which numerical summary would you choose for these data? Calculate your chosen summary. How does it reflect the skewness of the distribution?
8. Below are the test scores for a Biology Test: 81 77 63 92 97 68 72 a) Create a histogram of the data provided above. 88 78 96 85 66 95 70 (Use the scale: 50-60, 60 -70... to create your table for graphing 80 99 63 58 93 75 83 89 94 92 85 76 87 -> 90 b) Create a Stem Plot for the data Stem Leaves 1090-100 33 68 70 2567 801355789 9 022345679 c) Describe its main features,: Shape: ued to the left. Peaks: Hutuaons whe att a0-10015the peeacC. Spread: Dtlu Sphead of the doa. Center: udiant teManeCentral datafur tawed obta. par leff from the hiyam sanoutier 8Uau 58, is an autlicer. Outlier. (c) Which numerical summary would you choose for these data? Calculate your chosen summary. How does it reflect the skewness of the distribution?

ChapterP: Prerequisites
SectionP.6: The Rectangular Coordinate System And Graphs
Problem 2ECP

Related questions
Question
100%
I just need the second part of C.) answered please.
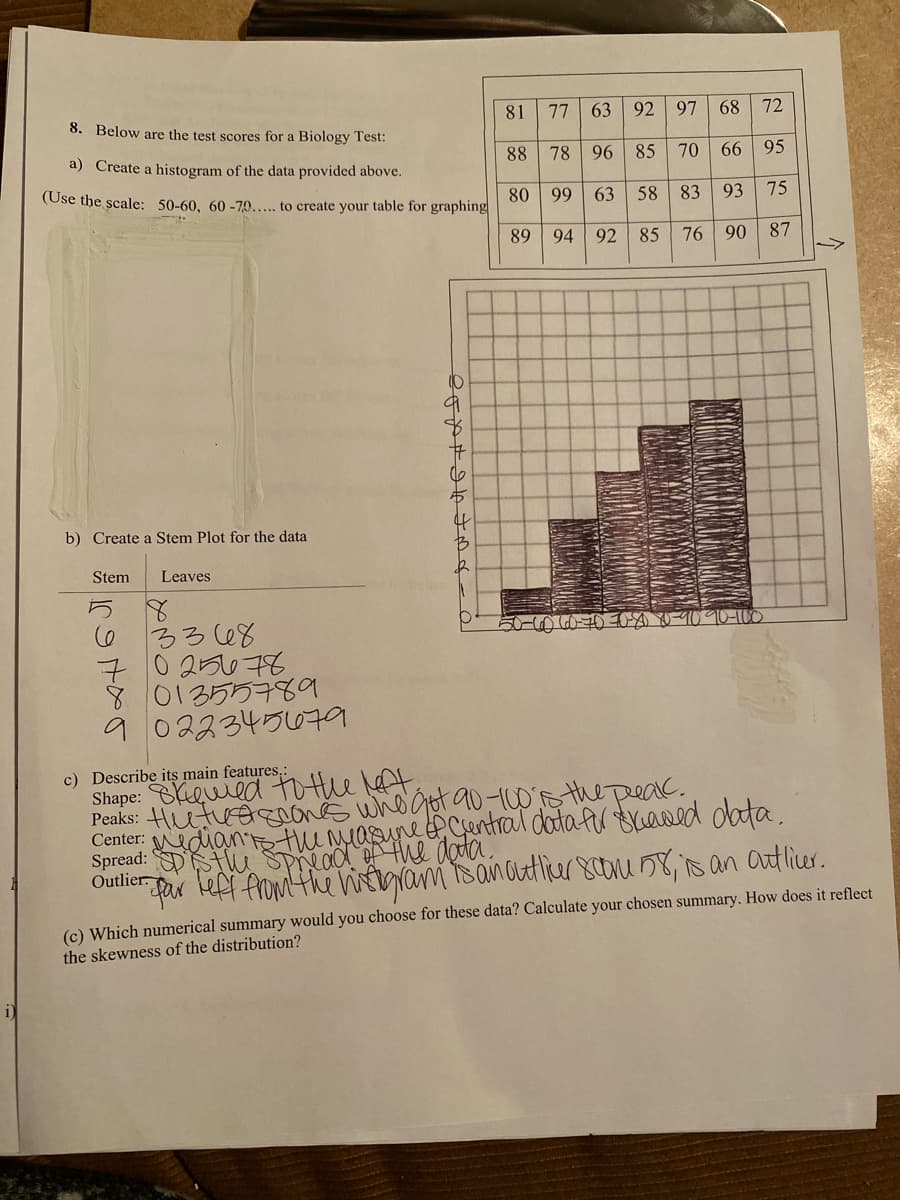
Transcribed Image Text:81
77
63
92
97
68 72
8. Below are the test scores for a Biology Test:
a) Create a histogram of the data provided above.
88
78 96 85 70
66
95
80
(Use the scale: 50-60, 60 -70... to create your table for graphing
99
63 58 83
93
75
89
94
92
85
76 90
87
4
b) Create a Stem Plot for the data
Stem
Leaves
3368
70 2567
801355789
9 022345679
c) Describe its main features,:
Shape: eued to the lft.
Peaks: Hutue s whoata90-10s the peac.
Center: udianthemauneCentral dotafur trawed dota.
Spread: Dtu pheadl the doa.
Outlier.
Par leff from the Wam sanoutier8ou 58, is an atlier.
(c) Which numerical summary would you choose for these data? Calculate your chosen summary. How does it reflect
the skewness of the distribution?
Expert Solution
This question has been solved!
Explore an expertly crafted, step-by-step solution for a thorough understanding of key concepts.

This is a popular solution!

Trending now
This is a popular solution!

Step by step
Solved in 2 steps with 2 images

Recommended textbooks for you

Trigonometry (MindTap Course List)
Trigonometry
ISBN:
9781337278461
Author:
Ron Larson
Publisher:
Cengage Learning

Glencoe Algebra 1, Student Edition, 9780079039897…
Algebra
ISBN:
9780079039897
Author:
Carter
Publisher:
McGraw Hill
Trigonometry (MindTap Course List)
Trigonometry
ISBN:
9781337278461
Author:
Ron Larson
Publisher:
Cengage Learning
Glencoe Algebra 1, Student Edition, 9780079039897…
Algebra
ISBN:
9780079039897
Author:
Carter
Publisher:
McGraw Hill

Big Ideas Math A Bridge To Success Algebra 1: Stu…
Algebra
ISBN:
9781680331141
Author:
HOUGHTON MIFFLIN HARCOURT
Publisher:
Houghton Mifflin Harcourt

Holt Mcdougal Larson Pre-algebra: Student Edition…
Algebra
ISBN:
9780547587776
Author:
HOLT MCDOUGAL
Publisher:
HOLT MCDOUGAL