8. The circle graph represents the percent of choices to a local poll. If there were a total of 60 people polled, how many of them chose winter? Summer 35% Spring 25% Fall 25% (A) 3 (B) 6 (C) 9 (D) 12 Winter
8. The circle graph represents the percent of choices to a local poll. If there were a total of 60 people polled, how many of them chose winter? Summer 35% Spring 25% Fall 25% (A) 3 (B) 6 (C) 9 (D) 12 Winter

Glencoe Algebra 1, Student Edition, 9780079039897, 0079039898, 2018
18th Edition
ISBN:9780079039897
Author:Carter
Publisher:Carter
Chapter10: Statistics
Section10.6: Summarizing Categorical Data
Problem 23PPS

Related questions
Question
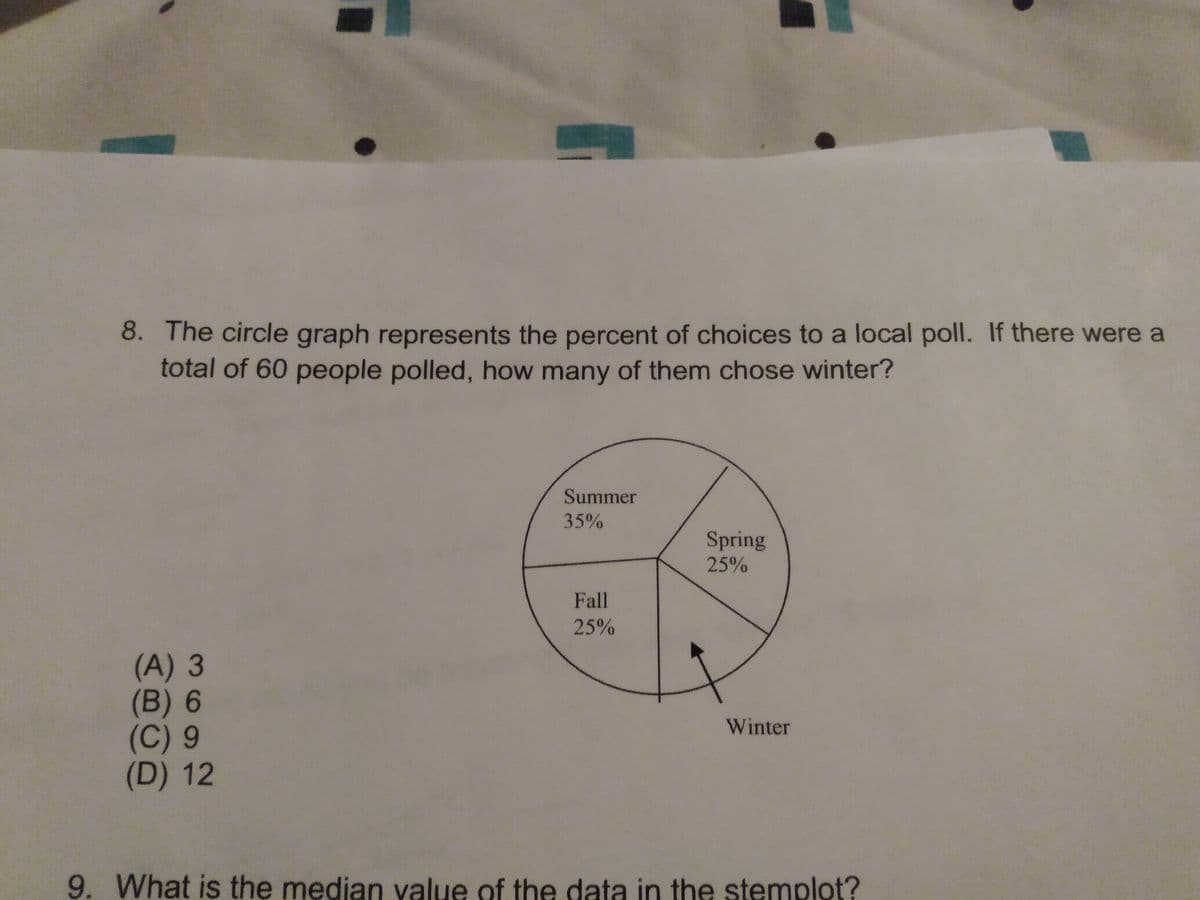
Transcribed Image Text:8. The circle graph represents the percent of choices to a local poll. If there were a
total of 60 people polled, how many of them chose winter?
Summer
35%
Spring
25%
Fall
25%
(A) 3
(B) 6
(C) 9
(D) 12
Winter
9. What is the median value of the data in the stemplot?
Expert Solution
This question has been solved!
Explore an expertly crafted, step-by-step solution for a thorough understanding of key concepts.

Step by step
Solved in 2 steps with 2 images

Knowledge Booster


Learn more about
Need a deep-dive on the concept behind this application? Look no further. Learn more about this topic, algebra and related others by exploring similar questions and additional content below.Recommended textbooks for you
Glencoe Algebra 1, Student Edition, 9780079039897…
Algebra
ISBN:
9780079039897
Author:
Carter
Publisher:
McGraw Hill
Glencoe Algebra 1, Student Edition, 9780079039897…
Algebra
ISBN:
9780079039897
Author:
Carter
Publisher:
McGraw Hill