Protective coatings of plastic and metal are commonly used on manufactured goods to prevent wear and to add beauty to finished products. Coating flaws of various kinds, from small holes to large scratches, not only expose items to possible damage but also are unattractive to consumers. The following c chart monitors the numbers of surface flaws found on certain kitchen appliances. In this chart, 8 appliances are selected each hour, and the total number of coating flaws found on the collection of items is graphed on the chart. c chart 7 6. 4 3 5 11 13 15 17 19 23 25 27 Subgroup number For a process such as this to be "in statistical control," only random patterns of points should appear on the control chart. The process is "not in statistical control" when any non-random patterns appear on the chart. Three commonly used tests or rules for signaling that a process may not be in statistical control are: • Rule 1: One or more points fall outside one of the chart's control limits • Rule 2: Nine points in a row are on the same side of the chart's centerline • Rule 3: Six points in a row are increasing (or decreasing). Using these three rules, identify which (if any) of the rules gives an "out of control" signal, and indicate the subgroup number at which the signal is first given. Does the rule give an "out What is the subgroup Rule # of control" signal? (Check number at which the the box that applies) ? signal is first given? O Yes O No O Yes O No Yes No 21 2. 3.
Protective coatings of plastic and metal are commonly used on manufactured goods to prevent wear and to add beauty to finished products. Coating flaws of various kinds, from small holes to large scratches, not only expose items to possible damage but also are unattractive to consumers. The following c chart monitors the numbers of surface flaws found on certain kitchen appliances. In this chart, 8 appliances are selected each hour, and the total number of coating flaws found on the collection of items is graphed on the chart. c chart 7 6. 4 3 5 11 13 15 17 19 23 25 27 Subgroup number For a process such as this to be "in statistical control," only random patterns of points should appear on the control chart. The process is "not in statistical control" when any non-random patterns appear on the chart. Three commonly used tests or rules for signaling that a process may not be in statistical control are: • Rule 1: One or more points fall outside one of the chart's control limits • Rule 2: Nine points in a row are on the same side of the chart's centerline • Rule 3: Six points in a row are increasing (or decreasing). Using these three rules, identify which (if any) of the rules gives an "out of control" signal, and indicate the subgroup number at which the signal is first given. Does the rule give an "out What is the subgroup Rule # of control" signal? (Check number at which the the box that applies) ? signal is first given? O Yes O No O Yes O No Yes No 21 2. 3.

Glencoe Algebra 1, Student Edition, 9780079039897, 0079039898, 2018
18th Edition
ISBN:9780079039897
Author:Carter
Publisher:Carter
Chapter10: Statistics
Section10.1: Measures Of Center
Problem 8PPS

Related questions
Question
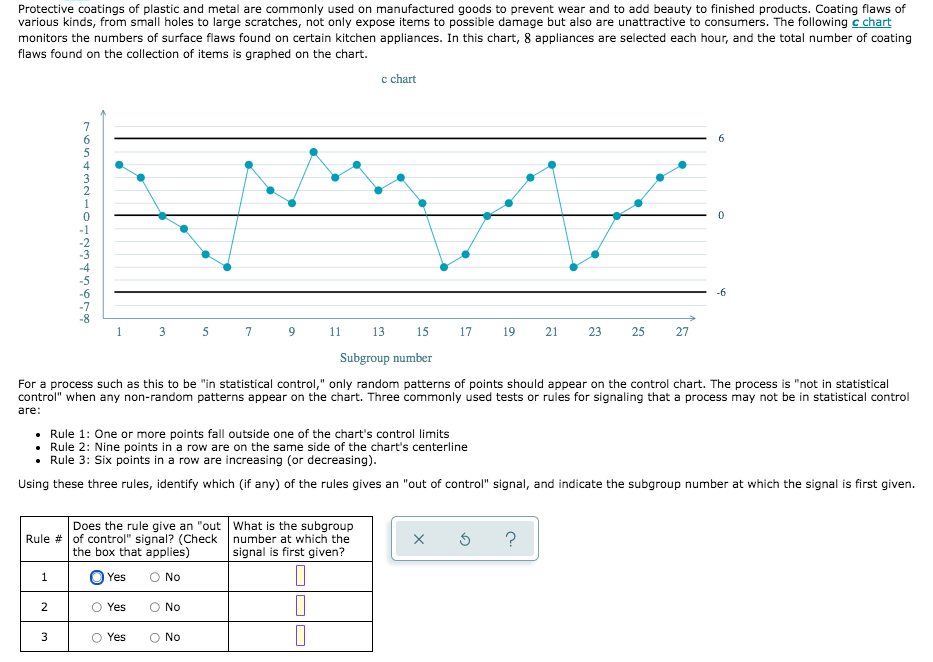
Transcribed Image Text:Protective coatings of plastic and metal are commonly used on manufactured goods to prevent wear and to add beauty to finished products. Coating flaws of
various kinds, from small holes to large scratches, not only expose items to possible damage but also are unattractive to consumers. The following c chart
monitors the numbers of surface flaws found on certain kitchen appliances. In this chart, 8 appliances are selected each hour, and the total number of coating
flaws found on the collection of items is graphed on the chart.
c chart
7
6.
-1
-6
1.
3
7
9
11
13
15
17
19
21
23
25
27
Subgroup number
For a process such as this to be "in statistical control," only random patterns of points should appear on the control chart. The process is "not in statistical
control" when any non-random patterns appear on the chart. Three commonly used tests or rules for signaling that a process may not be in statistical control
are:
• Rule 1: One or more points fall outside one of the chart's control limits
• Rule 2: Nine points in a row are on the same side of the chart's centerline
• Rule 3: Six points in a row are increasing (or decreasing).
Using these three rules, identify which (if any) of the rules gives an "out of control" signal, and indicate the subgroup number at which the signal is first given.
Does the rule give an "out What is the subgroup
Rule # of control" signal? (Check number at which the
signal is first given?
the box that applies)
1
O Yes
O No
Yes
O No
O Yes
O No
2.
3.
Expert Solution
This question has been solved!
Explore an expertly crafted, step-by-step solution for a thorough understanding of key concepts.

This is a popular solution!

Trending now
This is a popular solution!

Step by step
Solved in 4 steps

Recommended textbooks for you
Glencoe Algebra 1, Student Edition, 9780079039897…
Algebra
ISBN:
9780079039897
Author:
Carter
Publisher:
McGraw Hill


Algebra and Trigonometry (MindTap Course List)
Algebra
ISBN:
9781305071742
Author:
James Stewart, Lothar Redlin, Saleem Watson
Publisher:
Cengage Learning
Glencoe Algebra 1, Student Edition, 9780079039897…
Algebra
ISBN:
9780079039897
Author:
Carter
Publisher:
McGraw Hill
Algebra and Trigonometry (MindTap Course List)
Algebra
ISBN:
9781305071742
Author:
James Stewart, Lothar Redlin, Saleem Watson
Publisher:
Cengage Learning

College Algebra
Algebra
ISBN:
9781305115545
Author:
James Stewart, Lothar Redlin, Saleem Watson
Publisher:
Cengage Learning

Algebra: Structure And Method, Book 1
Algebra
ISBN:
9780395977224
Author:
Richard G. Brown, Mary P. Dolciani, Robert H. Sorgenfrey, William L. Cole
Publisher:
McDougal Littell