8. The table shown gives the national average pupil-teacher ratio in public schools over selected years. a. Find the equation for the least squares line. Let x correspond to the number of years since 1991 and let y correspond to the average number of pupils per 1 teacher. b. Use the answer from part (a) to predict the pupil-teacher ratio in 2020. Does this seem Year Ratio 1991 17.4 1994 17.7 1997 16.9 realistic? 2000 16.2 c. Calculate and interpret the correlation coefficient. 2003 15.8 a. The equation for the least squares line is Y = (Use integers or decimals for any numbers in the equation. Round to four decimal places as needed.) b. Using the answer from part (a), the pupil-teacher ratio in 2020 will be (Round to one decimal place as needed.) Does this seem realistic? No Yes c. Select the correct choice below and fill in the answer box to complete your choice. (Type an integer or decimal rounded to four decimal places as needed.) A. The correlation coefficient is which indicates a strong linear correlation. B. The correlation coefficient is which indicates that there is no linear correlation.
8. The table shown gives the national average pupil-teacher ratio in public schools over selected years. a. Find the equation for the least squares line. Let x correspond to the number of years since 1991 and let y correspond to the average number of pupils per 1 teacher. b. Use the answer from part (a) to predict the pupil-teacher ratio in 2020. Does this seem Year Ratio 1991 17.4 1994 17.7 1997 16.9 realistic? 2000 16.2 c. Calculate and interpret the correlation coefficient. 2003 15.8 a. The equation for the least squares line is Y = (Use integers or decimals for any numbers in the equation. Round to four decimal places as needed.) b. Using the answer from part (a), the pupil-teacher ratio in 2020 will be (Round to one decimal place as needed.) Does this seem realistic? No Yes c. Select the correct choice below and fill in the answer box to complete your choice. (Type an integer or decimal rounded to four decimal places as needed.) A. The correlation coefficient is which indicates a strong linear correlation. B. The correlation coefficient is which indicates that there is no linear correlation.

Linear Algebra: A Modern Introduction
4th Edition
ISBN:9781285463247
Author:David Poole
Publisher:David Poole
Chapter7: Distance And Approximation
Section7.3: Least Squares Approximation
Problem 34EQ

Related questions
Question
Transcribed Image Text:8.
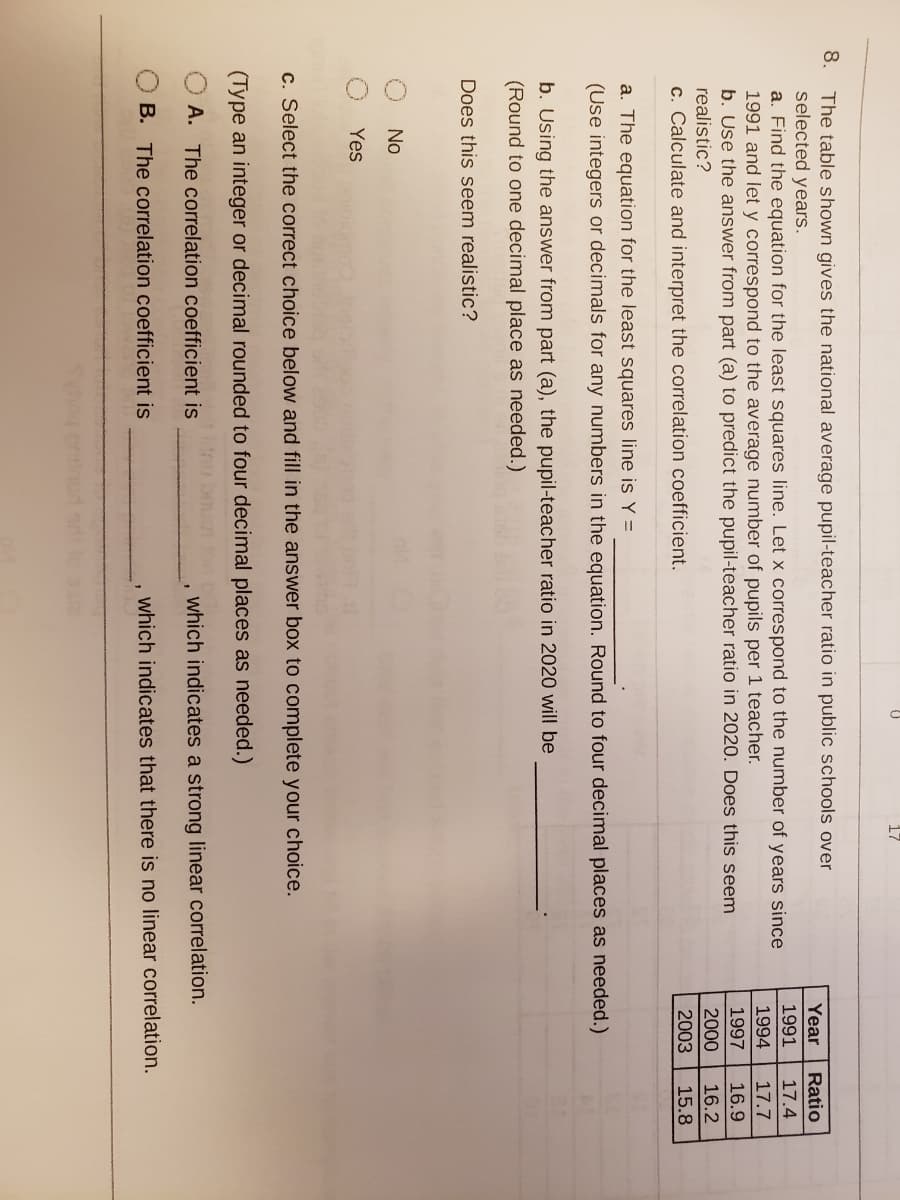
The table shown gives the national average pupil-teacher ratio in public schools over
selected years.
a. Find the equation for the least squares line. Let x correspond to the number of years since
1991 and let y correspond to the average number of pupils per 1 teacher.
b. Use the answer from part (a) to predict the pupil-teacher ratio in 2020. Does this seem
realistic?
Year
Ratio
1991
17.4
1994
17.7
1997
16.9
2000
16.2
c. Calculate and interpret the correlation coefficient.
2003
15.8
a. The equation for the least squares line is Y =
(Use integers or decimals for any numbers in the equation. Round to four decimal places as needed.)
b. Using the answer from part (a), the pupil-teacher ratio in 2020 will be
(Round to one decimal place as needed.)
Does this seem realistic?
No
Yes
c. Select the correct choice below and fill in the answer box to complete your choice.
(Type an integer or decimal rounded to four decimal places as needed.)
A. The correlation coefficient is
which indicates a strong linear correlation.
B. The correlation coefficient is
which indicates that there is no linear correlation.
Expert Solution
This question has been solved!
Explore an expertly crafted, step-by-step solution for a thorough understanding of key concepts.

This is a popular solution!

Trending now
This is a popular solution!

Step by step
Solved in 4 steps with 12 images

Recommended textbooks for you
Linear Algebra: A Modern Introduction
Algebra
ISBN:
9781285463247
Author:
David Poole
Publisher:
Cengage Learning
Linear Algebra: A Modern Introduction
Algebra
ISBN:
9781285463247
Author:
David Poole
Publisher:
Cengage Learning