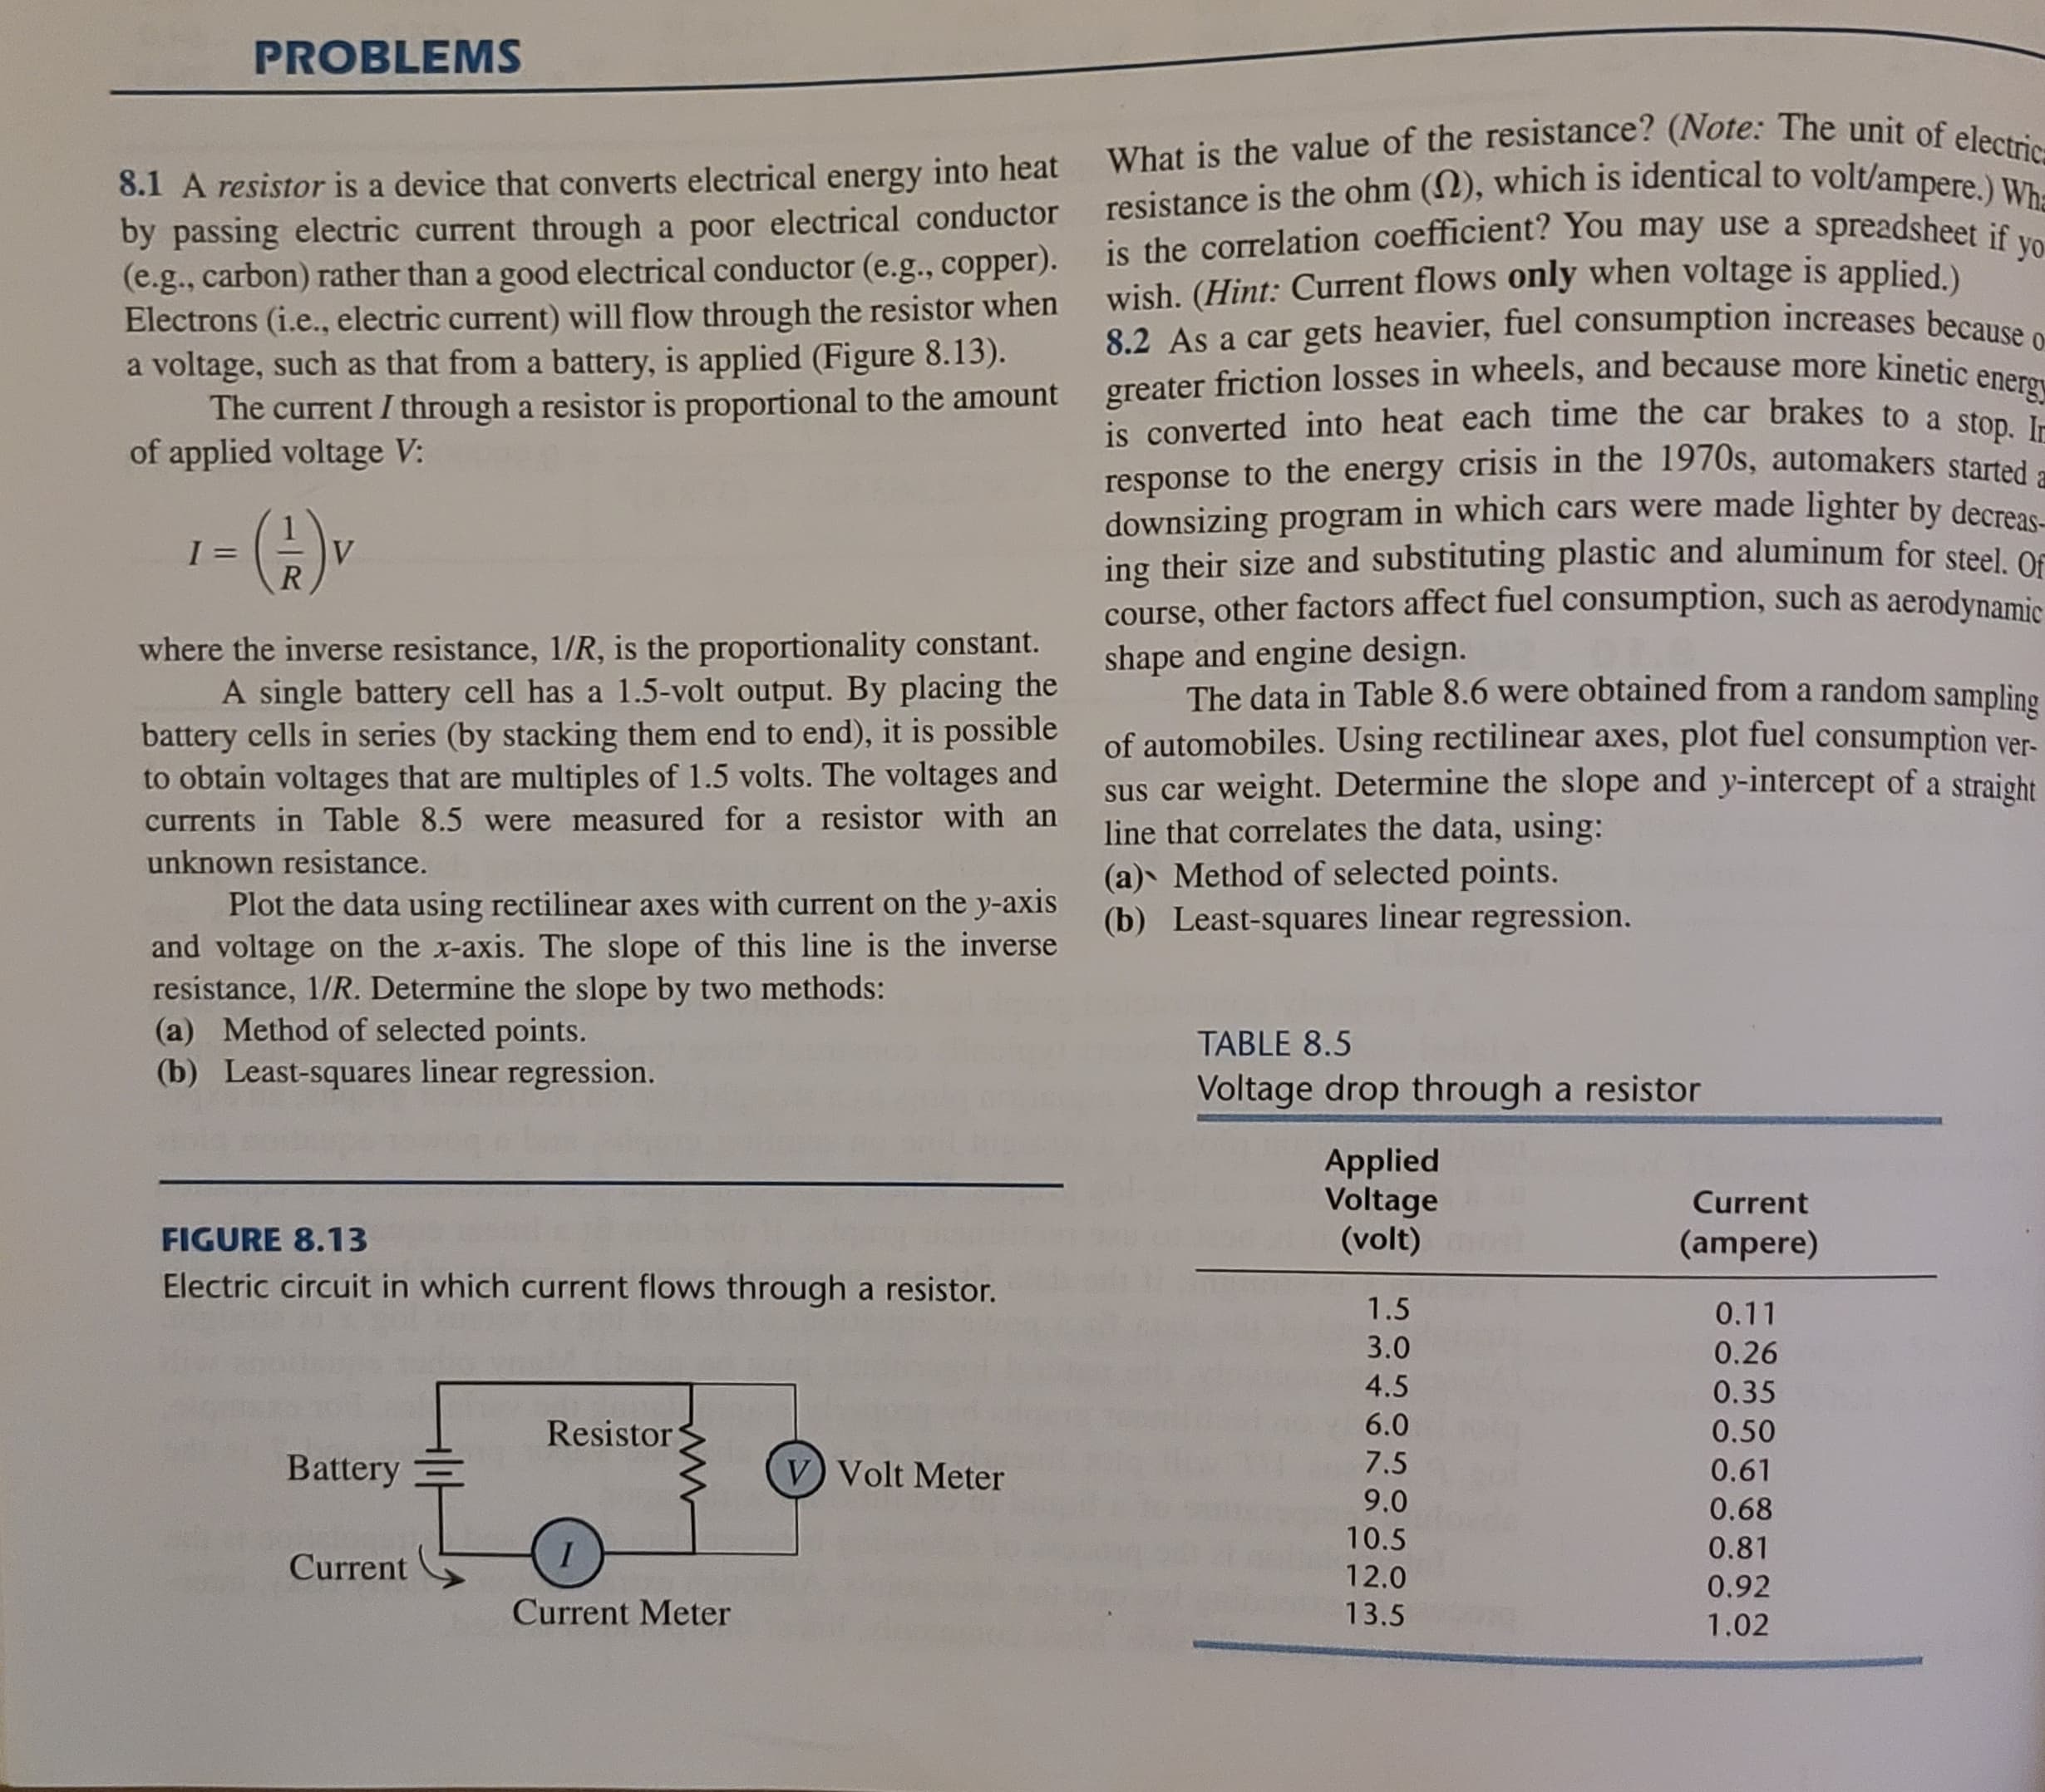
8.2 As a car gets heavier, greater friction losses in wheels, and because more kinetic energ is converted into heat each time the car brakes to a ston response to the energy crisis in the 1970s, automakers started- downsizing program in which cars were made lighter by decreas ing their size and substituting plastic and aluminum for steel OF course, other factors affect fuel consumption, such as aerodynamic because o shape and engine design. The data in Table 8.6 were obtained from a random sampling of automobiles. Using rectilinear axes, plot fuel consumption ver- sus car weight. Determine the slope and y-intercept of a straight line that correlates the data, using: (a) Method of selected points. (b) Least-squares linear regression.
8.2 As a car gets heavier, greater friction losses in wheels, and because more kinetic energ is converted into heat each time the car brakes to a ston response to the energy crisis in the 1970s, automakers started- downsizing program in which cars were made lighter by decreas ing their size and substituting plastic and aluminum for steel OF course, other factors affect fuel consumption, such as aerodynamic because o shape and engine design. The data in Table 8.6 were obtained from a random sampling of automobiles. Using rectilinear axes, plot fuel consumption ver- sus car weight. Determine the slope and y-intercept of a straight line that correlates the data, using: (a) Method of selected points. (b) Least-squares linear regression.

Residential Construction Academy: House Wiring (MindTap Course List)
4th Edition
ISBN:9781285852225
Author:Gregory W Fletcher
Publisher:Gregory W Fletcher
Chapter15: Special Residential Wiring Situations
Section: Chapter Questions
Problem 23RQ

Related questions

Question
100%
Hello, I need help with the answer of 8.2 from the picture, please.
>note: table 8.6 that the problem is asking for is in the second picture.
>note: this is not a graded question I am just having trouble understanding how to get to the answer thank you for your help
Transcribed Image Text:8.2 As a car gets heavier,
greater friction losses in wheels, and because more kinetic energ
is converted into heat each time the car brakes to a ston
response to the energy crisis in the 1970s, automakers started-
downsizing program in which cars were made lighter by decreas
ing their size and substituting plastic and aluminum for steel OF
course, other factors affect fuel consumption, such as aerodynamic
because o
shape and engine design.
The data in Table 8.6 were obtained from a random sampling
of automobiles. Using rectilinear axes, plot fuel consumption ver-
sus car weight. Determine the slope and y-intercept of a straight
line that correlates the data, using:
(a) Method of selected points.
(b) Least-squares linear regression.

Expert Solution
Step 1
Given data:
|
Automobile mass (lbm) |
Fuel consumption (mi/gal) |
|
2534 |
24.3 |
|
3023 |
15.9 |
|
2294 |
30.7 |
|
3797 |
12.5 |
|
2876 |
20.4 |
|
2382 |
35.8 |
|
3498 |
22.8 |
|
2475 |
40.3 |
|
2103 |
45.5 |
Step 2
Make a graph using the above data:
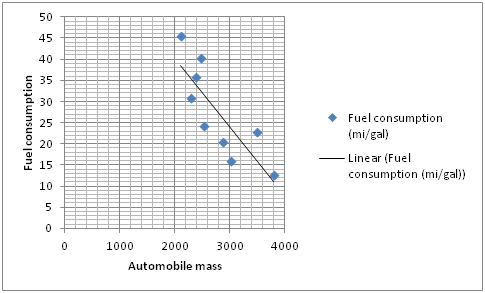
Step 3
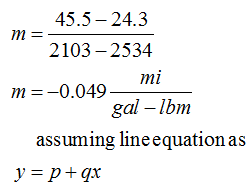
a) Now calculate the slope of the linear fuel consumption line:

Trending now
This is a popular solution!

Step by step
Solved in 5 steps with 4 images

Knowledge Booster


Learn more about
Need a deep-dive on the concept behind this application? Look no further. Learn more about this topic, civil-engineering and related others by exploring similar questions and additional content below.Recommended textbooks for you
Residential Construction Academy: House Wiring (M…
Civil Engineering
ISBN:
9781285852225
Author:
Gregory W Fletcher
Publisher:
Cengage Learning
Residential Construction Academy: House Wiring (M…
Civil Engineering
ISBN:
9781285852225
Author:
Gregory W Fletcher
Publisher:
Cengage Learning