82. The time (in minutes) until the next bus departs a major bus depot follows a distribution with f(x) * where x goes 20 from 25 to 45 minutes. a. Define the random variable. X = b. X~. c. Graph the probability distribution.
82. The time (in minutes) until the next bus departs a major bus depot follows a distribution with f(x) * where x goes 20 from 25 to 45 minutes. a. Define the random variable. X = b. X~. c. Graph the probability distribution.

MATLAB: An Introduction with Applications
6th Edition
ISBN:9781119256830
Author:Amos Gilat
Publisher:Amos Gilat
Chapter1: Starting With Matlab
Section: Chapter Questions
Problem 1P

Related questions
Question
100%
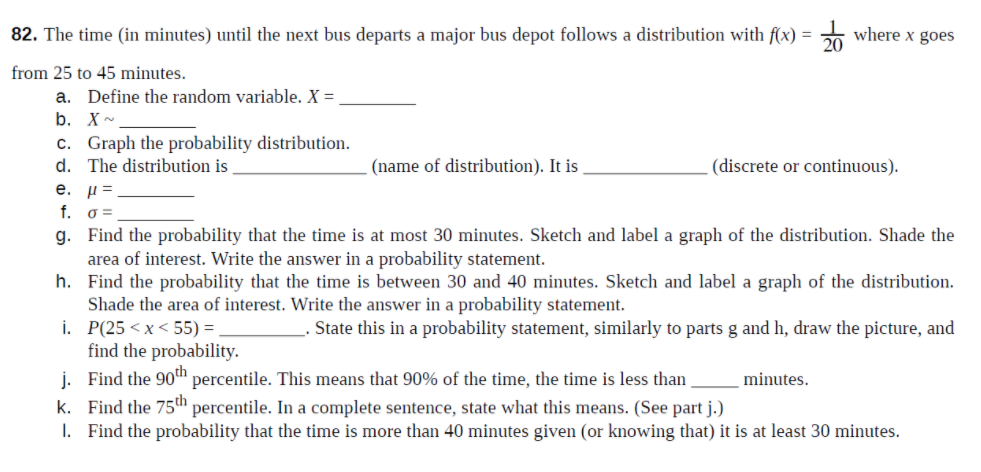
Transcribed Image Text:82. The time (in minutes) until the next bus departs a major bus depot follows a distribution with f(x) =
E where x goes
from 25 to 45 minutes.
a. Define the random variable. X =
b. X-
c. Graph the probability distribution.
d. The distribution is
(name of distribution). It is
(discrete or continuous).
e. µ=
f. o =
g. Find the probability that the time is at most 30 minutes. Sketch and label a graph of the distribution. Shade the
area of interest. Write the answer in a probability statement.
h. Find the probability that the time is between 30 and 40 minutes. Sketch and label a graph of the distribution.
Shade the area of interest. Write the answer in a probability statement.
i. P(25 < x< 55) = ,
find the probability.
j. Find the 90ª percentile. This means that 90% of the time, the time is less than ,
k. Find the 75th percentile. In a complete sentence, state what this means. (See part j.)
I. Find the probability that the time is more than 40 minutes given (or knowing that) it is at least 30 minutes.
State this in a probability statement, similarly to parts g and h, draw the picture, and
minutes.
Expert Solution
This question has been solved!
Explore an expertly crafted, step-by-step solution for a thorough understanding of key concepts.

Step by step
Solved in 2 steps with 2 images

Recommended textbooks for you
MATLAB: An Introduction with Applications
Statistics
ISBN:
9781119256830
Author:
Amos Gilat
Publisher:
John Wiley & Sons Inc

Probability and Statistics for Engineering and th…
Statistics
ISBN:
9781305251809
Author:
Jay L. Devore
Publisher:
Cengage Learning

Statistics for The Behavioral Sciences (MindTap C…
Statistics
ISBN:
9781305504912
Author:
Frederick J Gravetter, Larry B. Wallnau
Publisher:
Cengage Learning
MATLAB: An Introduction with Applications
Statistics
ISBN:
9781119256830
Author:
Amos Gilat
Publisher:
John Wiley & Sons Inc
Probability and Statistics for Engineering and th…
Statistics
ISBN:
9781305251809
Author:
Jay L. Devore
Publisher:
Cengage Learning
Statistics for The Behavioral Sciences (MindTap C…
Statistics
ISBN:
9781305504912
Author:
Frederick J Gravetter, Larry B. Wallnau
Publisher:
Cengage Learning

Elementary Statistics: Picturing the World (7th E…
Statistics
ISBN:
9780134683416
Author:
Ron Larson, Betsy Farber
Publisher:
PEARSON

The Basic Practice of Statistics
Statistics
ISBN:
9781319042578
Author:
David S. Moore, William I. Notz, Michael A. Fligner
Publisher:
W. H. Freeman

Introduction to the Practice of Statistics
Statistics
ISBN:
9781319013387
Author:
David S. Moore, George P. McCabe, Bruce A. Craig
Publisher:
W. H. Freeman