891, 937, 959, 1017, 1047, 1097, 1169, 1173, 1184, 1235, 1266, 1345, 1353, 1357, 1391, 1414, 1453, 1524, 1557, 1581, 1583, 1590, 1658, 1685, 1690, 1734, 1744, 1765, 1776, 1783, 1783, 1790, 1797, 1849, 1862, 1888, 1894, 1895, 1901, 1906, 1928, 1941, 1949, 1952, 1960, 2022, 2037, 2048, 2052, 2058, 2067, 2103, 2109, 2113, 2163, 2178, 2240, 2245, 2269, 2288, 2452, 2651, 2668, 2886, 2921, 3045, 3276, 3356, 3439, 3749, 4387, 4437, 4578, 4899, 5000, 5290, 5404, 5867, 6128, 6666, 7103, 7757, 7999, 8019, 8773, 9296, 9475, 9595, 9838, 10016 create a table of frequency using this formula. show your solution
891, 937, 959, 1017, 1047, 1097, 1169, 1173, 1184, 1235, 1266, 1345, 1353, 1357, 1391, 1414, 1453, 1524, 1557, 1581, 1583, 1590, 1658, 1685, 1690, 1734, 1744, 1765, 1776, 1783, 1783, 1790, 1797, 1849, 1862, 1888, 1894, 1895, 1901, 1906, 1928, 1941, 1949, 1952, 1960, 2022, 2037, 2048, 2052, 2058, 2067, 2103, 2109, 2113, 2163, 2178, 2240, 2245, 2269, 2288, 2452, 2651, 2668, 2886, 2921, 3045, 3276, 3356, 3439, 3749, 4387, 4437, 4578, 4899, 5000, 5290, 5404, 5867, 6128, 6666, 7103, 7757, 7999, 8019, 8773, 9296, 9475, 9595, 9838, 10016 create a table of frequency using this formula. show your solution

Big Ideas Math A Bridge To Success Algebra 1: Student Edition 2015
1st Edition
ISBN:9781680331141
Author:HOUGHTON MIFFLIN HARCOURT
Publisher:HOUGHTON MIFFLIN HARCOURT
Chapter11: Data Analysis And Displays
Section: Chapter Questions
Problem 10CT

Related questions
Question
891, 937, 959, 1017, 1047, 1097, 1169, 1173, 1184, 1235, 1266, 1345, 1353, 1357, 1391, 1414, 1453, 1524, 1557, 1581, 1583, 1590, 1658, 1685, 1690, 1734, 1744, 1765, 1776, 1783, 1783, 1790, 1797, 1849, 1862, 1888, 1894, 1895, 1901, 1906, 1928, 1941, 1949, 1952, 1960, 2022, 2037, 2048, 2052, 2058, 2067, 2103, 2109, 2113, 2163, 2178, 2240, 2245, 2269, 2288, 2452, 2651, 2668, 2886, 2921, 3045, 3276, 3356, 3439, 3749, 4387, 4437, 4578, 4899, 5000, 5290, 5404, 5867, 6128, 6666, 7103, 7757, 7999, 8019, 8773, 9296, 9475, 9595, 9838, 10016
create a table of frequency using this formula. show your solution
Transcribed Image Text:32
10:51 PM O A
Roexanne Jovenir
AD X
F x
ANx UN
Dr xa MC x
X Cax x
UNx
2/SECONDSEMESTER/STATS/OANNOATED pat
O Add text
V Oraw
Y Hig
+ 2 E Page view A Read aloud
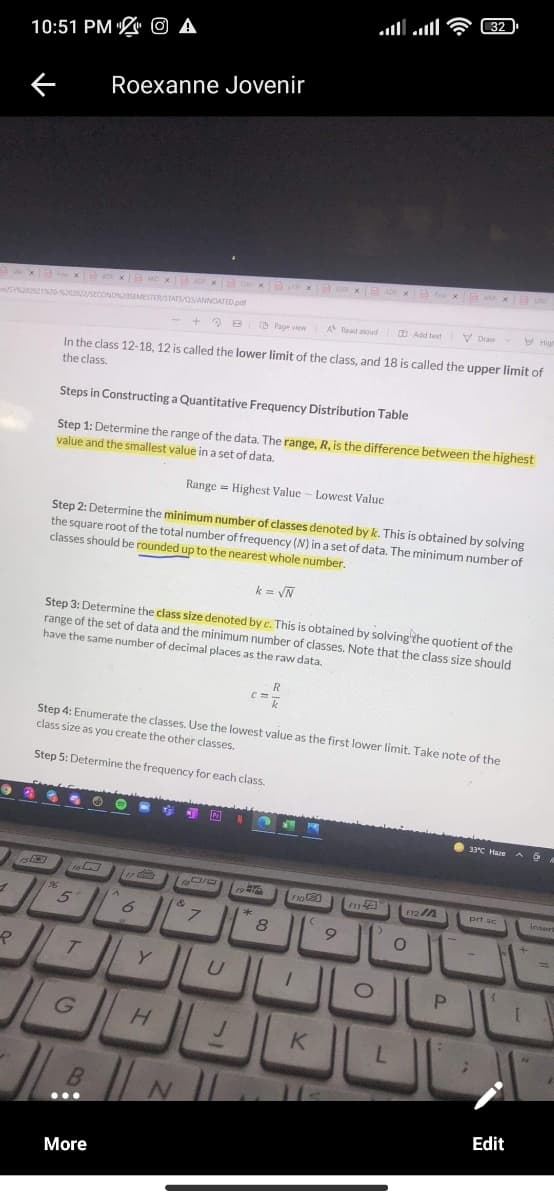
In the class 12-18, 12 is called the lower limit of the class, and 18 is called the upper limit of
the class.
Steps in Constructing a Quantitative Frequency Distribution Table
Step 1: Determine the range of the data. The range, R, is the difference between the highest
value and the smallest value in a set of data.
Range = Highest Value - Lowest Value
Step 2: Determine the minimum number of classes denoted by k. This is obtained by solving
the square root of the total number of frequency (N) in a set of data. The minimum number of
classes should be rounded up to the nearest whole number.
k = VN
Step 3: Determine the class size denoted by c. This is obtained by solving the quotient of the
range of the set of data and the minimum number of classes. Note that the class size should
have the same number of decimal places as the raw data.
R
Step 4: Enumerate the classes. Use the lowest value as the first lower limit. Take note of the
class size as you create the other classes.
Step 5: Determine the frequency for each class.
O 33°C Haze A 6
no
F11
F12A
prt sc
Insor
7.
Y
P.
H.
K
...
Edit
More
Expert Solution
This question has been solved!
Explore an expertly crafted, step-by-step solution for a thorough understanding of key concepts.

Step by step
Solved in 2 steps with 1 images

Recommended textbooks for you
Big Ideas Math A Bridge To Success Algebra 1: Stu…
Algebra
ISBN:
9781680331141
Author:
HOUGHTON MIFFLIN HARCOURT
Publisher:
Houghton Mifflin Harcourt

Glencoe Algebra 1, Student Edition, 9780079039897…
Algebra
ISBN:
9780079039897
Author:
Carter
Publisher:
McGraw Hill
Big Ideas Math A Bridge To Success Algebra 1: Stu…
Algebra
ISBN:
9781680331141
Author:
HOUGHTON MIFFLIN HARCOURT
Publisher:
Houghton Mifflin Harcourt
Glencoe Algebra 1, Student Edition, 9780079039897…
Algebra
ISBN:
9780079039897
Author:
Carter
Publisher:
McGraw Hill