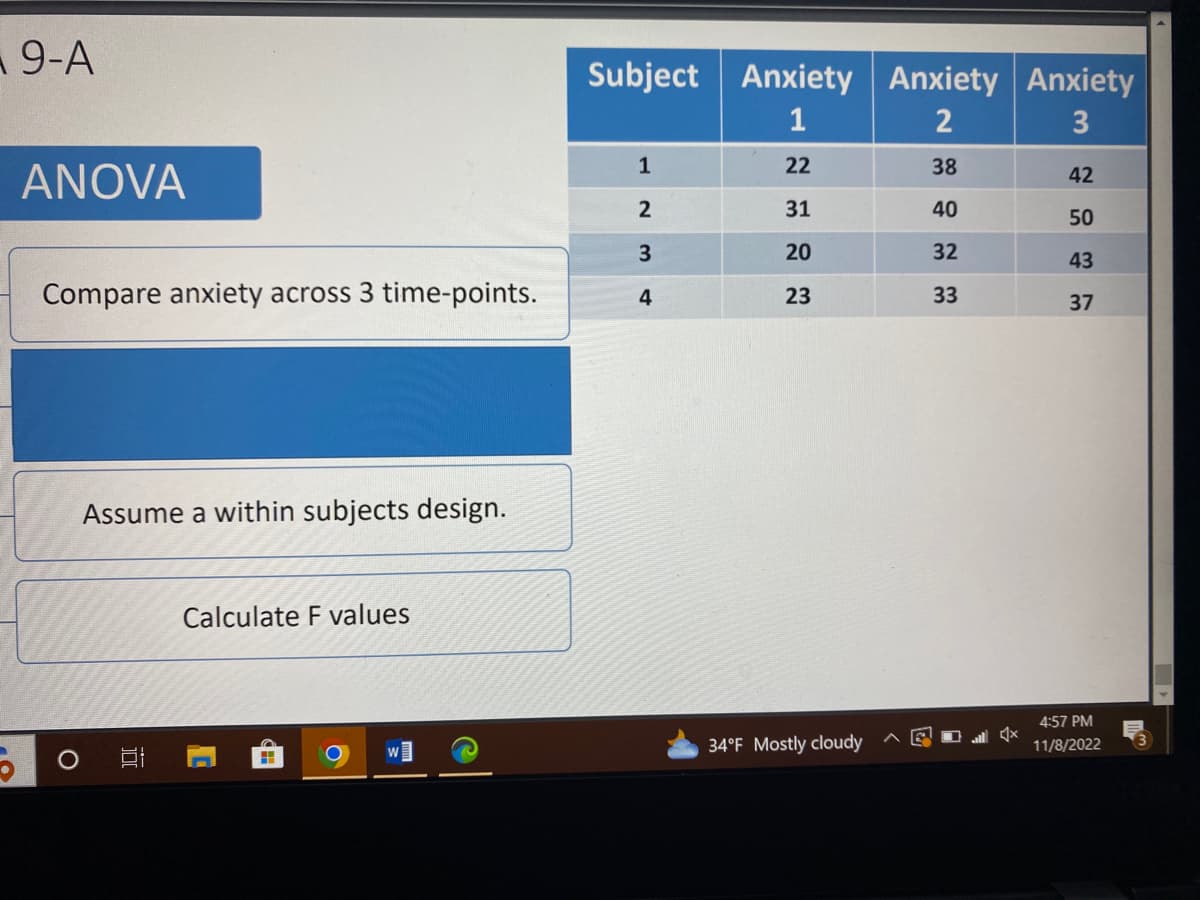
9-A ANOVA Compare anxiety across 3 time-points. Assume a within subjects design. Calculate F values Subject Anxiety Anxiety Anxiety 1 2 3 22 38 31 40 20 32 23 33 1 2 3 4 42 50 43 37


Q: Problem 3) The random variable X has the following probability density function: fx(x) = {cx a) Find…
A: It is given that the random variable has the pdf fX(x) = { cx, 0 ≤ x ≤ 2 0, otherwise }…
Q: In this exercise involving paired differences, consider that it is reasonable to assume the…
A: Given information: Additive Car 1 2 1 19.12 17.05 2 24.56 20.77 3 23.03 23.57 4 18.15…
Q: A manufacturer is interested in the output voltage of a power supply used in a PC. Output voltage is…
A: Given Information: Standard deviation σ=0.14 H0:μ=5 H1:μ≠5 Sample size n=7
Q: Assume that a hypothesis test of the given claim will be conducted. Identify the type I or type II…
A: The claim is that the proportion of Americans that have seen a UFO is less than 1 in a thousand.
Q: h would be correct hypotheses for this test? ) Ho: μ Ho: μ = 90, H1:μ > 90 Ho:90, H₁:μ = 90 > Ho: μ…
A:
Q: Commuters A recent random survey of 100 individuals in Michigan found that 78 drove to work alone. A…
A: Given: n1 = 100 X1 = 78 n2 = 140 X2 = 60 Confidence level = 90% Formula Used: 90% Confidence…
Q: Standard Error from a Formula and a Bootstrap Distribution Use StatKey or other technology to…
A: Given n=51 P-hat=0.381
Q: i) Show that the standard score of the sample mean X, is equal to Y. ii) Show that the mean and…
A: It is given that X follows N(θ, 1), then E(X) = θ and V(X) = 1, And the moment genarating function…
Q: 2.5.5. Find the probability of the union of the events a < X₁ <b, -∞0 < X₂ <∞0, and -∞ < X₁ <∞, c<…
A:
Q: 23. The numbers of tourists (in thousands) visiting Table Mountain in Cape Town per quarter, for…
A: The regression equation is given by, y= a+bx Then, from the above data set:
Q: Determine whether the growth (or decay) is linear or exponential, and answer the associated…
A: Today population is 327. it increase at rate of 336 people per year. here population increase at fix…
Q: Trisha has received the following grades this term: 75, 87, 90, 88, 79. If she wishes to earn an 85…
A: Given values: 75 87 90 88 79 Consider, the average value for above grades, SPSS Procedure: Enter…
Q: Let N be the last digit of your student number. Let X and Y be two continuous random variables that…
A:
Q: Refer to the accompanying data display that results from a sample of airport data speeds in Mbps.…
A: Given that CI=(13.046,22.15) x=17.598 Sx=16.01712719 n=50
Q: According to a study, the proportion of people who are satisfied with the way things are yo Complete…
A: Given Information: The proportion of people who are satisfied with the way things are going in their…
Q: According to a recent article about individuals who have credit cards, the mean number of cards per…
A: It is given that the mean number of cards per individual is less than 4.
Q: A study suggests that the 48% of 25 year olds have gotten married. You believe that this is…
A: given data, n=321x=143p^=xn=143321=0.4455claim :p≠0.48α=0.05
Q: Let X be any distribution that has a mean of 50 and a standard deviation of 10. If you took a sample…
A:
Q: Which has the larger standard deviation? O Figure (a) Figure (b) What is the mean of the curve in…
A:
Q: suppose you are comparing seven groups ANOVA, your is signifi want to perform multiple comparison…
A: Given that αfw=0.01. There are 7 groups in an ANOVA. Number of comparing groups is seven.
Q: The following table shows retail sales in drug stores in billions of dollars in the U.S. for years…
A: Regression line is used to predict the variable based on the another. It has two types of variables,…
Q: Assume that the probability of a being born with Genetic Condition B is p = 29/30. A study looks at…
A: Given data, p=2930 =0.9667n=174we have to find out the mean and standard deviation for the given…
Q: The View Key pregnancies in a small rural village are normally distributed with a mean of 260 days…
A: given data, normal distribution μ=260σ=13let X be the length of a randomly recorded pregnancy in the…
Q: Cost of Building a Home According to the National Association of Home Builders, the average cost of…
A: Given Sample size n=42, sample mean x̄=124.51, level of significance ɑ=0.01, standard deviations…
Q: Statistics students in Oxnard College sampled 11 textbooks in the Condor bookstore and recorded the…
A: The following data are passed: X Y 855 139.7 325 59.5 914 144.96 939 139.46 623 108.22…
Q: A company claims that the mean weight per apple they ship is 120 grams with a standard deviation of…
A: given data n = 49x¯ = 122.5σ = 12claim : μ= 120
Q: Calculate the approximate quantity relatives to two decimal places for the MTN and Cell C stocks…
A:
Q: An experiment with 2 treatments (A and B) was conducted. Treatment A had 11 replications and…
A: It is given that treatment A has 11 replications and treatment B has 9 replications.
Q: QUESTION THREE Traffic engineers are studying the correlation between traffic flow on a busy main…
A: "Since you have posted a question with multiple subparts, we will solve first 3 sub-parts for you.…
Q: c) Suppose that the results of carrying out the hypothesis test lead to non-rejection of the null…
A: Given information: H0:θ=0.90H1:θ=0.60 Let Y be the number of patients recovered from COVID-19 after…
Q: (a) The area to the right of Z=-1.86 is (Round to four decimal places as needed.) (b) The area to…
A: It is given that the standard normal random variable Z. Note: According to Bartleby expert…
Q: A population of values has a normal distribution with μ = 109.1 and o = 70.6. You intend to draw a…
A: given data, normal distributionμ=109.1σ=70.6n=69we have to find out the given probability for thr…
Q: A tire manufacturer wants to ensure that the tires produced are of a consistent quality so that…
A: Solution : Given that, confidence level=90% 1-α=0.90α=0.10 n=12 now degrees of freedom df=n-1…
Q: 8.116 For a t-curve with df = 17, use Table IV to find each t-value. c. to.005 b. fo.025 a. to.05
A: Followings are the Explanation of the question Use the t table and find the t-critical value when…
Q: The one-time fling! Have you ever purchased an article of clothing (dress, sports jacket, etc.),…
A: Givenp=0.05sample size(n)=10Let "x" be the no.of persons has done a one-time…
Q: An atomic absorption method for the determination of the amount of iron present in used jet engine…
A: Confidence interval is used to measure the range where the true population mean lies. Confidences…
Q: You invented an iPhone app. The mean time that users engage with this app is 8.2 minutes and the…
A: The mean is 8.2 minutes and the standard deviation is 1 minute.
Q: Test the claim that the mean GPA of night students is larger than 2.7 at the 0.005 significance…
A: The claim is that the mean GPA of night students is larger than 2.7.
Q: Researchers are testing shoes for comfort. They recruit more than 750 adults and randomly assigned…
A: Given: About 750 adults are recruited. Half of them are randomly assigned to a name-brand shoe.…
Q: Part 2: Use your Graphing Calculator. (You may also use Desmos Graphing Calculator) Month, x…
A: Let X be the month and Y be the average monthly temp. x y x^2 y^2 xy 1 38 1 1444 38 2 42 4…
Q: Let X1, X2, X3, Xn denote a random sample of size n from the population distributed with the…
A:
Q: Suppose babies born after a gestation period of 32 to 35 weeks have a mean weight of 2600 grams and…
A: GivenGestation period of 32-35 weeks haveMean(μ)=2600standard deviation(σ)=70Gestation period of 40…
Q: ume that a procedure yields a binomial distribution with a trial repeated n times. Use the binomial…
A: given data,binomial distribution,n=4x=3p=0.45q=1-0.45=0.55p(X=x)=nCx *px*qn-x (binomial distribution…
Q: 2. Consider Rolling a Fair six sided Dice with sides of 2, 3, 3, 4, 4, 5 (so replace the 1 & 6 with…
A: Given the experiment of rolling a fair xix sided dice with sides of 2, 3, 3, 4, 4, 5.
Q: Let X₁, X2, X3, ..., Xn be a random sample of size n from population X. Suppose that X~N (8,1) Σ and…
A: Given X~N(θ,1) ; i=1,2,...,n
Q: Assuming that the heights of college women are normally distributed with mean 70 inches and standard…
A: Given Mean=70 Standard deviation=2.9
Q: The standard deviation in the pressure required to open a certain valve is known to be o=1.2 psi.…
A: Null and alternative hypothesis : Null hypothesis : In statistics, null hypothesis is a statement…
Q: he mean age of 30 randomly selected Republican Senators was 61 years 247 days old (61.675 years)…
A: given data, Democratic senatorsn1=30x¯1=61.704 yearss1=9.55republic senators n2=30x¯2=61.675…
Q: b) Let X₁, X₂,..., Xn and Y₁, Y2,, Ym be random samples from populations with moment generating 25…
A:
Q: The data in Figure 2 below has to do with the stocks of three of South Africa's biggest mobile…
A: Solution: From the given information,

Step by step
Solved in 2 steps with 1 images

- A common characterization of obese individuals is that their body mass index is at least 30 [BMI = weight/(height)2, where height is in meters and weight is in kilograms]. An article reported that in a sample of female workers, 269 had BMIs of less than 25, 156 had BMIs that were at least 25 but less than 30, and 121 had BMIs exceeding 30. Is there compelling evidence for concluding that more than 20% of the individuals in the sampled population are obese? (a) State the appropriate hypotheses with a significance level of 0.05. H0: p = 0.20Ha: p > 0.20H0: p > 0.20Ha: p = 0.20 H0: p = 0.20Ha: p < 0.20H0: p = 0.20Ha: p ≠ 0.20 Calculate the test statistic and determine the P-value. (Round your test statistic to two decimal places and your P-value to four decimal places.) z=P-value= What can you conclude? Reject the null hypothesis. There is sufficient evidence that more than 20% of the population of female workers is obese.Reject the null hypothesis. There is not…A sample of 120 employees of a company is selected, and the average age is found to be 37 years. Parameter or stasistic?A report in LTO stated that the average age of taxis in the Philippines is 9 years. An operations manager of a large taxi company selects a sample of 40 taxis and finds the average age of the taxis is 8.2 years. The σ of the population is 2.3 years. At ? = 0.05, can it be concluded that the average age of the taxis in his company is less than the national average?
- 7. The manufacturer of an Engine Energizer System (EES) claims that it improves gas mileage and reduces emissions in automobiles by using magnetic-free energy to increase the amount of oxygen in the fuel for greater combustion efficiency. Following are test results, performed under international and U.S. government agency standards, on a random sample of 14 vehicles. The data (also see file M09_Gas_Paired.txt or M09_Gas_Q7.xlsx) give the carbon monoxide (CO) levels, in parts per million, of each vehicle tested, both before installation of EES and after installation. (a)Test at the 1% significance level whether, on average, EES reduces CO emissions (b)Obtain a 99% confidence interval for the difference between the mean CO emissions before and after installation of EES corresponding to the test in part (a) (c)Interpret the confidence interval obtained in part (b). Does this interval support the conclusion of the hypothesis test in part (a)? Justify your answerAccording to research, of all U.S. households that owned at least one TV set, 83% had two or more sets. A local cable company canvassing the town to promote a new cable service found that of the 295 households visited, 230 had two or more TV sets. At (alpha) = 0.10, is there sufficient evidence to conclude that the proportion is less than the one in the report? A. State the hypotheses and identify the claim with the correct hypothesis. B. Find the critical value(s). C. Compute the test value. D. Make the decision. E. Summarize the results.Calculateaconfidenceinterval for the me-dian ofthe second population.Select your confidenc eleve land reportit with your answer.??
- 8,8.3 - test startic/ t=? - P-value?A survey of 90 recently delivered women on the rolls of a county welfare department revealed that 27 had a history of intrapartum or postpartum infection. Can we conclude that the population proportion with a history of intrapartum or postpartum infection is less than or equal to 0.25. Let alpha = 0.05A common characterization of obese individuals is that their body mass index is at least 30 [BMI = weight/(height)2, where height is in meters and weight is in kilograms]. An article reported that in a sample of female workers, 269 had BMIs of less than 25, 156 had BMIs that were at least 25 but less than 30, and 121 had BMIs exceeding 30. Is there compelling evidence for concluding that more than 20% of the individuals in the sampled population are obese? (c) What is the probability of not concluding that more than 20% of the population is obese when the actual percentage of obese individuals is 23%? (Round your answer to four decimal places.)
- Out of 188 men over age 65 years, 70 were still working. 87 out of 202 women over the age of 65 yearswere still working. At a 0.08 level of significance, can you claim the proportion of men and women workingover the age of 65 is the same? a.)State the hypotheses and label the claim. b) Is the test left-tailed, right-tailed, or two-tailed (circle one)?c) What is/are the critical value(s)? Draw a picture. d) What is the P-value and test-statistic?e) Give two reasons for your decision to reject/not reject H0 based on: 1) Test statistic compared to criticalvalue 2) P-value compared to α Then, state the conclusion by relating back to the original claim.To examine the relationship between alcohol consumption and birth weight, a researcher selects a sample of n = 20 pregnant rats and mixes alcohol with their food for 2 weeks before the pups are born. One newborn pup is randomly selected from each subject’s litter and the average with weight for the n = 20 pups is recorded. It is known that the average birth weight for regular rats (without exposure to alcohol) is μ = 5.6 grams. What type of test would you use to test the hypothesis that alcohol consumption during pregnancy reduces birth weights? Would you use a one-tailed or two-tailed test? What would be an appropriate measure of effect size to report?Next, given a situation in which a research reports a large eta squared effect size (eta squared = .64), why might their reported t value be small and not statistically significant? What may be inference from such a situation? Indicate and provide examples of three of the factors that influence the size of t.


