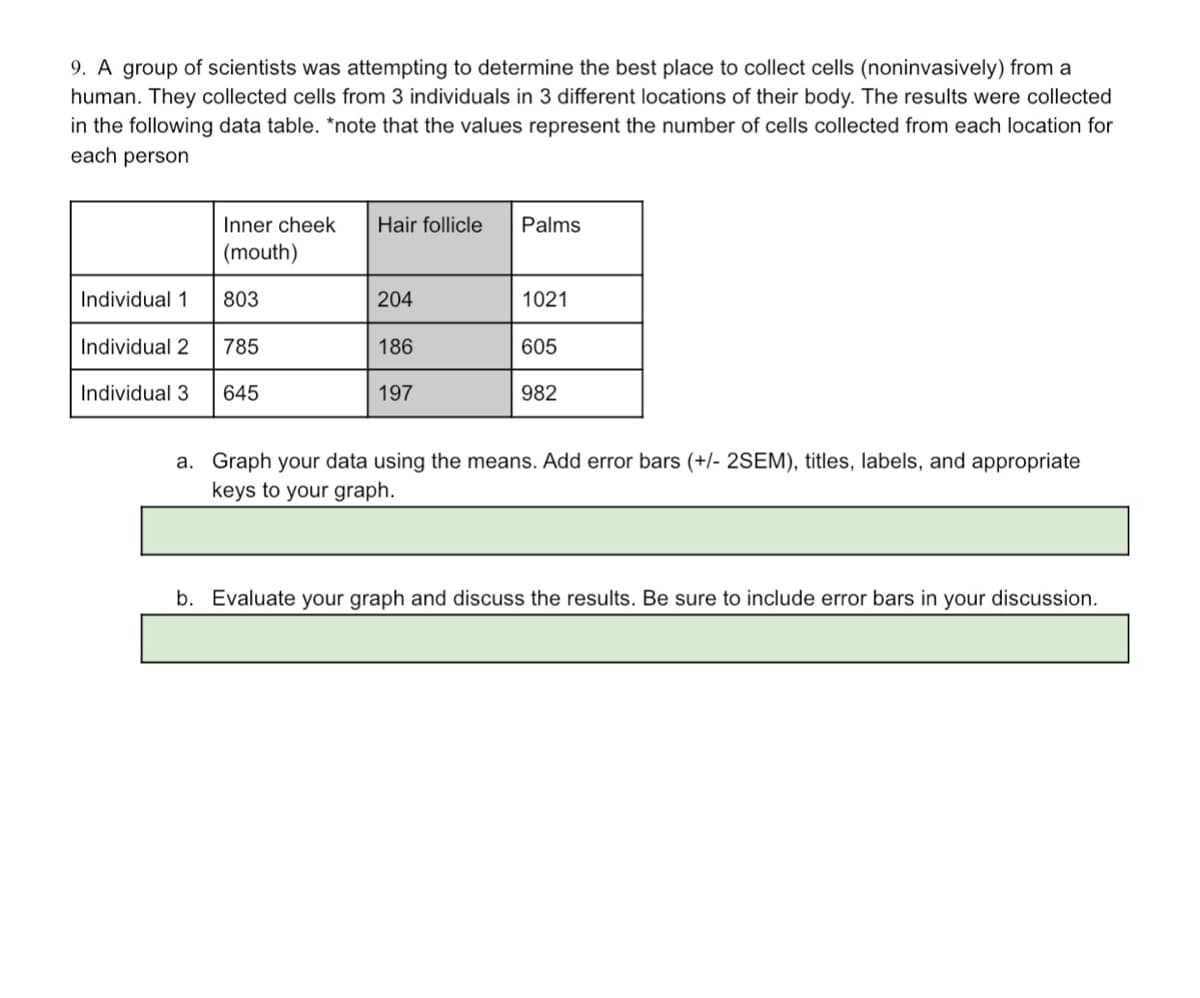
9. A group of scientists was attempting to determine the best place to collect cells (noninvasively) from a human. They collected cells from 3 individuals in 3 different locations of their body. The results were collected in the following data table. *note that the values represent the number of cells collected from each location for each person Inner cheek Hair follicle Palms (mouth) Individual 1 803 204 1021 Individual 2 785 186 605 Individual 3 645 197 982 a. Graph your data using the means. Add error bars (+/- 2SEM), titles, labels, and appropriate keys to your graph. b. Evaluate your graph and discuss the results. Be sure to include error bars in your discussion.
9. A group of scientists was attempting to determine the best place to collect cells (noninvasively) from a human. They collected cells from 3 individuals in 3 different locations of their body. The results were collected in the following data table. *note that the values represent the number of cells collected from each location for each person Inner cheek Hair follicle Palms (mouth) Individual 1 803 204 1021 Individual 2 785 186 605 Individual 3 645 197 982 a. Graph your data using the means. Add error bars (+/- 2SEM), titles, labels, and appropriate keys to your graph. b. Evaluate your graph and discuss the results. Be sure to include error bars in your discussion.

Algebra & Trigonometry with Analytic Geometry
13th Edition
ISBN:9781133382119
Author:Swokowski
Publisher:Swokowski
Chapter10: Sequences, Series, And Probability
Section10.8: Probability
Problem 32E

Related questions
Topic Video
Question
The question is in the image
Transcribed Image Text:9. A group of scientists was attempting to determine the best place to collect cells (noninvasively) from a
human. They collected cells from 3 individuals in 3 different locations of their body. The results were collected
in the following data table. *note that the values represent the number of cells collected from each location for
each person
Inner cheek
Hair follicle
Palms
(mouth)
Individual 1
803
204
1021
Individual 2
785
186
605
Individual 3
645
197
982
a. Graph your data using the means. Add error bars (+/- 2SEM), titles, labels, and appropriate
keys to your graph.
b. Evaluate your graph and discuss the results. Be sure to include error bars in your discussion.
Expert Solution
This question has been solved!
Explore an expertly crafted, step-by-step solution for a thorough understanding of key concepts.

This is a popular solution!

Trending now
This is a popular solution!

Step by step
Solved in 2 steps

Knowledge Booster


Learn more about
Need a deep-dive on the concept behind this application? Look no further. Learn more about this topic, statistics and related others by exploring similar questions and additional content below.Recommended textbooks for you
Algebra & Trigonometry with Analytic Geometry
Algebra
ISBN:
9781133382119
Author:
Swokowski
Publisher:
Cengage

Holt Mcdougal Larson Pre-algebra: Student Edition…
Algebra
ISBN:
9780547587776
Author:
HOLT MCDOUGAL
Publisher:
HOLT MCDOUGAL
Algebra & Trigonometry with Analytic Geometry
Algebra
ISBN:
9781133382119
Author:
Swokowski
Publisher:
Cengage
Holt Mcdougal Larson Pre-algebra: Student Edition…
Algebra
ISBN:
9780547587776
Author:
HOLT MCDOUGAL
Publisher:
HOLT MCDOUGAL