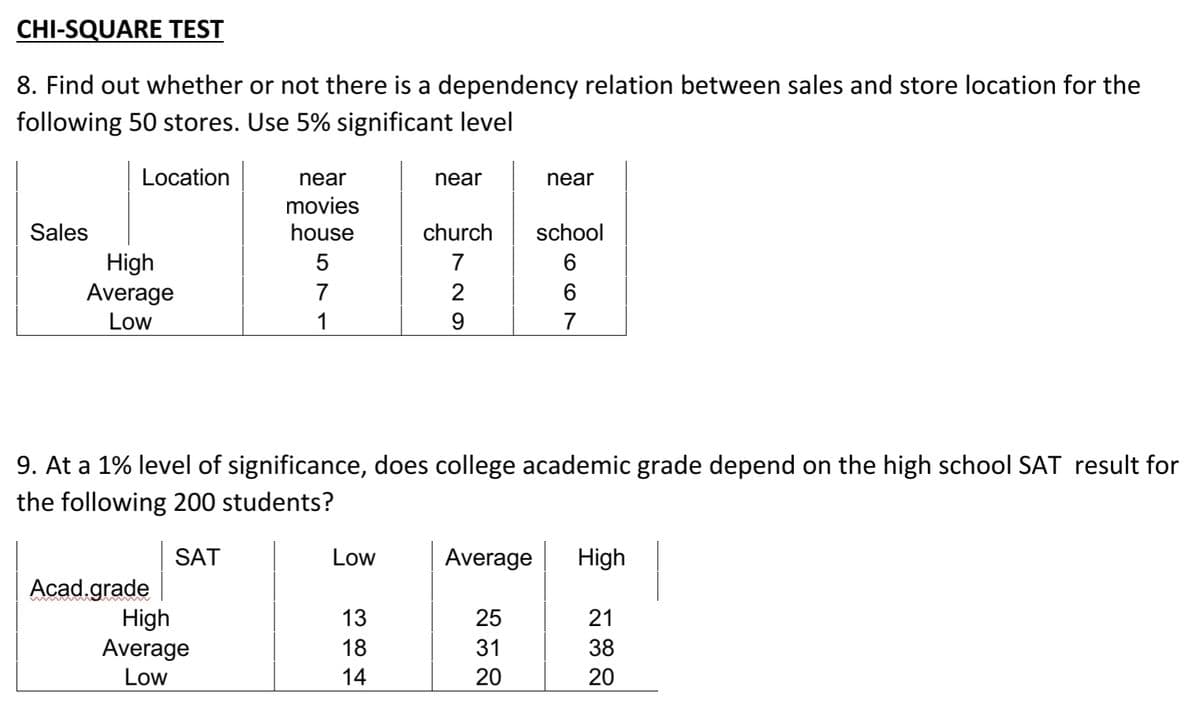
9. At a 1% level of significance, does college academic grade depend on the high school SAT result for the following 200 students?


Q: Topic: Regression, Correlation and ANOVA. Completely solve. Write legibly. The use of excel and such…
A: Note: As per guidelines we will only answer the first three subparts, please repost other subparts…
Q: For numbers 9 and 10: Nathan, a friend of Jonard, wants to predict the petal length (plength, cm) of…
A: We have given that the software output of multiple regression analysis.
Q: 1. What is the percentile for 86? 2 Find the 2nd percentile. Find the 2nd quartile.
A: 1) The percentile for 86 is = (number of values < 86/total number of values)*100 = (31/50)*100…
Q: The owner of a chain of mini-markets wants to compare the sales performance of two of her stores,…
A:
Q: Which option below contains things that do not ALL match each other? a. pα, test value inside…
A: Solution
Q: Number of pets owned Frequency Relative Frequency Cumulative Relative Frequency 0 22 0.3607…
A: Mean is calculated by averaging all the observation in the data set. Standard deviation is…
Q: Referring to Table 10-1, at the α = 0.10 level, the correct critical value(s) is (are)
A: From the given table, Sample size for loction 1, n1 = 20 Sample size for location 2, n2 = 20
Q: (a) A multiple-choice test paper contains 50 questions; for each question three answers are given,…
A: Since you have asked multiple question, we will solve the first question for you. If youwant any…
Q: art of blood pressure (in millimetres of m
A: class interval frequency 90-105 24 105-120 62 120-135 72 135-150 26 150-165 12…
Q: 27. Find the maximum likelihood parameters in the distribution given below based on a random sample…
A:
Q: The test statistic of z = 0.51 is obtained when testing the claim that p> 0.5. a. Identify the…
A:
Q: The table below gives data purporting to show the percentages of men and women whose daily…
A: Pie chart is a visual representation of categorical data.
Q: A random sample of 30 students had a final exam average of 86 with a standard deviation of 2 points.…
A:
Q: Is there any way I could see an explanation for question 2?
A: There are two categorical variables which are profitability and location type. We have to test…
Q: For the blocks installed in front of you, find the arithmetic median in two ways: 1/ the classified…
A:
Q: For a normal distribution with a mean of μ = 90 and a standard deviation of σ = 5, what is p(X>87)?…
A: We have given the following information about the normal distribution Mean = 90 Standard deviation…
Q: According to the Oxnard College Student Success Committee report in the previous year, we believe…
A: Given information: Confidence level is 95%. Significance level is 5%. From the standard normal…
Q: The national housing authority (NHA) wants to investigate the relationship between the size of…
A: From the above data size of Hours is independent variable X Monthly rent is dependent variable Y…
Q: An airline is trying two new boarding procedures, Option 1 and Option 2, to load passengers onto…
A: For the given data perform z test for two population mean
Q: Direction: Compute and Illustrate the distribution of the mean. 1. The average price of a computer…
A: Given that. X~N( μ , ?^2 ) μ=789 , ?=348 , n=27 Z-score =( x - μ )/? For mean x̄ ~…
Q: 1. In a manufacturing company, a new production process is being considered to replace the old…
A:
Q: Q1/ The limits of the second category 1 are 47 70 87 45 17 33 90 57 72 65 69 35 49 40 10 22 29 70 44…
A: For the given data, we need to find the frequency distribution table.
Q: 2. The number of hours spent playing video games a week by the residents of Minneapolis has a mean…
A: Given information:
Q: ONLY ILLUSTRATE THE DISTRIBUTION OF MEAN. DO THIS TYPEWRITTEN FOR UPVOTE, NO UPVOTE FOR HANDWRITTEN.…
A: Let z be the standard normally distributed random variable with mean 0 and standard deviation 1
Q: Two competing brands, Rain and Shine, produced two different latex paints and planned to sponsor a…
A:
Q: 1. The National Housing Authority (NHA) wants to investigate the relationship between the size of…
A: The scatter diagram gives the graphical relationship between two variables. It can be constructed…
Q: For the blocks installed in front of you, find the geometric median by the tabbed method and the…
A:
Q: A manufacturer knows that their items have a normally distributed lifespan, with a mean of 9.6…
A:
Q: Consider a deck of 52 cards with 4 suits and 13 cards (2-10,J,K,Q,A) in each suit. Jack takes one…
A: Solution: A deck of 52 cards contain 4 suits. Each suit has 13 cards. A deck of 52 cards contain 4…
Q: 11
A: 11. Let 'X1' be the random variable represents the drying time (in hour) for paint brand 'Rain'…
Q: It was believed that implementing strict measures is key in reducing the spread of a new virus. A…
A: Z test is used to test the mean significance between the sample and population. It follows the…
Q: Create a Venn diagram of this Problem Question: A survey of 85 students asked them about the…
A:
Q: Let M be the event that a randomly selected IRSC student is male and P(M) = 0.47. Round solutions to…
A: For the given data Find all the required probabilities
Q: 4. Given $1,000.00, the following spot exchange rates, and assuming zero transaction costs, explain…
A:
Q: Graph the damped vibration curve, d(t) = e-t/a.cos(2t) for 0<t< 2n. Create and complete the table in…
A:
Q: QUESTION 7 A rum producer monitors the position of its label on the bottle by sampling four bottles…
A:
Q: mputer manufacturer is interested in comparing assembly times for two keyboard assembly processes.…
A: Degrees of freedom = n-1 = 8-1 = 7
Q: Determine if prejudice is statistically significantly correlated with the acceptability of bullying?…
A:
Q: In a study focusing on student's achievement. 100 students were classified as low, average, or high…
A: a. In this case. 100 students were classified as low, average, or high achieving, based on the…
Q: 5. Use regression to determine an exponential model for the following data. Round all parameters to…
A: Regression is used for prediction purpose. equation of line of regression is y= a+bx where y is…
Q: The accompanying data came from a study of collusion in bidding within the construction industry.…
A: Given dataNo.of bidders No.of contracts2 83…
Q: Suppose the CDF of the random variable X is as follows: Fx(x) = Iij+1) (x) j+1 a. Use the given CDF…
A: The cumulative density function of a random variable X is given. The cumulative density function is…
Q: The following data are the amounts of total fat (in grams) in a few different kinds of sweet treats…
A:
Q: 4. A stenographer claims that she can type at the rate of 126 words per minute. Can we reject her…
A: Consider that μ is the population mean rate of typing word per minute.
Q: 131 Exercises Given: 78, 45, 60, 33, 84 Find the following descriptive measures: 1. range 2. MAD 3.…
A:
Q: Module TASsessr 17 4<ェ<8 8<HA 12 6. 12<I<16 18 16<z<20 10 20<I <24 24 < < 28 28< I < 32 32< z < 36…
A:
Q: Assume a significance level of a = 0.01 and use the given information to complete parts (a) and (b)…
A:
Q: Fitting plungers into holes A random variable X has a N(u,, o?) distribution. Independently, a…
A:
Q: Q.6.1 Experience has shown that the diameter of a machined component is normally distributed, with…
A:
Q: Adults aged 18 years old and older were randomly selected for a survey on obesity. Adults are…
A: From the provided information,
Answer number 9 only pls. and show your solution.

Step by step
Solved in 2 steps

- A 2012 suvey conducted by Idea Works provided data showing the percentage of seats avail- able when customers try to redeem points or miles for free travel. For each airline listed, the column labeled 2011 Percentage shows the percentage of seats available in 2011 and the column labeled 2012 shows the correponding percentage in 2012 (The Wall street Journal, May 17, 2012). Develop a scatter diagram with 2011 Percentage as the independent variable. What does the scatter diagram developed in part (a) indicate about the relationship between the two variables? Develop the estimated regression equation. Test for a significant relationship. Use α = 0.05. Did the estimated regression equation provide a good fit?well-known multinational FMCG produces more than fifty products and sells them in the market. Out of fifty products one is mineral water for drinking purpose and supplies different size pack bottles in the market. Product manager observed that, during hot days the sale of water is more as compared to the normal days. He started the collection of data of weekly sale of water and the average weekly temperature. Product manager was interested in developing a relationship between sales and temperature; therefore, he discussed and shared the following data with you. sales 75 77 69 63 79 80 77 70 73 87 72 73 80 80 69 84 77 72 74 81 temperature 32 36 31 31 34 29 32 35 28 31 30 31 29 35 36 28 32 33 32 33 Sale is in thousand liters and temperature is in degree Celsius. Data is Normally distributed You are required to determine the following information for some concrete decision: Determine the…A well-known multinational FMCG produces more than fifty products and sells them in themarket. Out of fifty products one is mineral water for drinking purpose and supplies differentsize pack bottles in the market. Product manager observed that, during hot days the sale of wateris more as compared to the normal days. He started the collection of data of weekly sale of waterand the average weekly temperature.Product manager was interested in developing a relationship between sales and temperature;therefore, he discussed and shared the following data with you. sales 7577696379807770738772738080698477727481 temperature 3236313134293235283130312935362832333233 Sale is in thousand liters and temperature is in degree Celsius. Data is Normally distributedYou are required to determine the following information for some concrete decision: a. Determine the statistical relationship between temperature and sale of water andinterpret.b. How much change in sales if the temperature…
- A sample of 548 ethnically diverse students from Massachusetts were followed over a 19-month period from 1995 and 1997 in a study of the relationship between TV viewing and eating habits.† For each additional hour of television viewed per day, the number of fruit and vegetable servings per day was found to decrease on average by 0.14 serving. (a) For this study, what is the dependent variable? location of students number of fruit and vegetable servings per day number of non fruit or vegetable servings per day number of hours of television viewed per day year What is the independent variable? location of students number of fruit and vegetable servings per day number of non fruit or vegetable servings per day number of hours of television viewed per day year (b) Would the least-squares line for predicting number of servings of fruits and vegetables using number of hours spent watching TV as a predictor have a positive or negative slope? Explain. The slope of the least squares line would…What variables do Teczar find to have the most significant controlled association with women in ministries?A lecturer would like to analyse whether there is a relationship between the country of origin of international students and the number of hours per day they spent on social media. write down two variables involved in the study above.
- A well-known multinational FMCG produces more than fifty products and sells them in the market. Out of fifty products one is mineral water for drinking purpose and supplies different size pack bottles in the market. Product manager observed that, during hot days the sale of water is more as compared to the normal days. He started the collection of data of weekly sale of water and the average weekly temperature. Product manager was interested in developing a relationship between sales and temperature; therefore, he discussed and shared the following data with you. sales 75 77 69 63 79 80 77 70 73 87 72 73 80 80 69 84 77 72 74 81 temperature 32 36 31 31 34 29 32 35 28 31 30 31 29 35 36 28 32 33 32 33 Sale is in thousand liters and temperature is in degree Celsius. Data is Normally distributed You are required to determine the following information for some concrete decision: Determine the…A well-known multinational FMCG produces more than fifty products and sells them in the market. Out of fifty products one is mineral water for drinking purpose and supplies different size pack bottles in the market. Product manager observed that, during hot days the sale of water is more as compared to the normal days. He started the collection of data of weekly sale of water and the average weekly temperature.Product manager was interested in developing a relationship between sales and temperature; therefore, he discussed and shared the following data with you. sales 75 77 69 63 79 80 77 70 73 87 72 73 80 80 69 84 77 72 74 81temperature 32 36 31 31 34 29 32 35 28 31 30 31 29 35 36 28 32 33 32 33 Sale is in thousand liters and temperature is in degree Celsius. Data is Normally distributed You are required to determine the following information for some concrete decision:a. Determine the statistical relationship between temperature and sale of water and interpret. b. How much change in…

