What variables do Teczar find to have the most significant controlled associa

Glencoe Algebra 1, Student Edition, 9780079039897, 0079039898, 2018
18th Edition
ISBN:9780079039897
Author:Carter
Publisher:Carter
Chapter4: Equations Of Linear Functions
Section4.5: Correlation And Causation
Problem 27PFA

Related questions
Question
What variables do Teczar find to have the most significant controlled association with women in ministries?
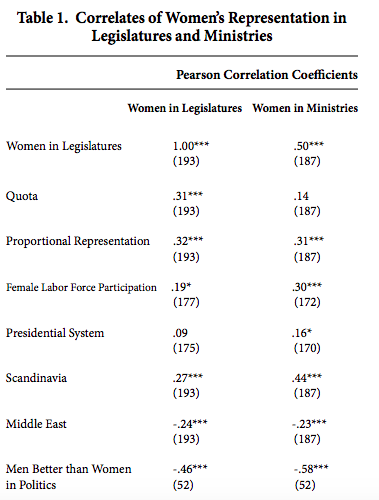
Transcribed Image Text:Table 1. Correlates of Women's Representation in
Legislatures and Ministries
Pearson Correlation Coefficients
Women in Legislatures Women in Ministries
Women in Legislatures
1.00***
(193)
.50***
(187)
Quota
31***
(193)
.14
(187)
Proportional Representation
.32***
.31***
(193)
(187)
Female Labor Force Participation .19*
.30***
(177)
(172)
Presidential System
.09
.16*
(175)
(170)
Scandinavia
27***
.44***
(193)
(187)
Middle East
-.24***
-.23***
(193)
(187)
Men Better than Women
-46***
-.58***
in Politics
(52)
(52)
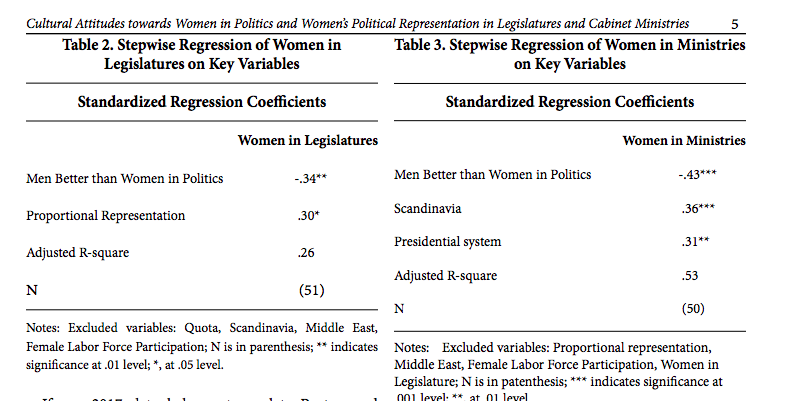
Transcribed Image Text:Cultural Attitudes towards Women in Politics and Women's Political Representation in Legislatures and Cabinet Ministries
Table 2. Stepwise Regression of Women in
Legislatures on Key Variables
5
Table 3. Stepwise Regression of Women in Ministries
on Key Variables
Standardized Regression Coefficients
Standardized Regression Coefficients
Women in Legislatures
Women in Ministries
Men Better than Women in Politics
-.34**
Men Better than Women in Politics
-.43***
Scandinavia
.36***
Proportional Representation
.30*
Presidential system
.31**
Adjusted R-square
.26
Adjusted R-square
.53
N
(51)
N
(50)
Notes: Excluded variables: Quota, Scandinavia, Middle East,
Notes: Excluded variables: Proportional representation,
Middle East, Female Labor Force Participation, Women in
Legislature; N is in patenthesis; *** indicates significance at
001 level: ** at 01 lexel
Female Labor Force Participation; N is in parenthesis; ** indicates
significance at .01 level; *, at .05 level.
Expert Solution
This question has been solved!
Explore an expertly crafted, step-by-step solution for a thorough understanding of key concepts.

Step by step
Solved in 2 steps

Recommended textbooks for you
Glencoe Algebra 1, Student Edition, 9780079039897…
Algebra
ISBN:
9780079039897
Author:
Carter
Publisher:
McGraw Hill

Big Ideas Math A Bridge To Success Algebra 1: Stu…
Algebra
ISBN:
9781680331141
Author:
HOUGHTON MIFFLIN HARCOURT
Publisher:
Houghton Mifflin Harcourt

Holt Mcdougal Larson Pre-algebra: Student Edition…
Algebra
ISBN:
9780547587776
Author:
HOLT MCDOUGAL
Publisher:
HOLT MCDOUGAL
Glencoe Algebra 1, Student Edition, 9780079039897…
Algebra
ISBN:
9780079039897
Author:
Carter
Publisher:
McGraw Hill
Big Ideas Math A Bridge To Success Algebra 1: Stu…
Algebra
ISBN:
9781680331141
Author:
HOUGHTON MIFFLIN HARCOURT
Publisher:
Houghton Mifflin Harcourt
Holt Mcdougal Larson Pre-algebra: Student Edition…
Algebra
ISBN:
9780547587776
Author:
HOLT MCDOUGAL
Publisher:
HOLT MCDOUGAL