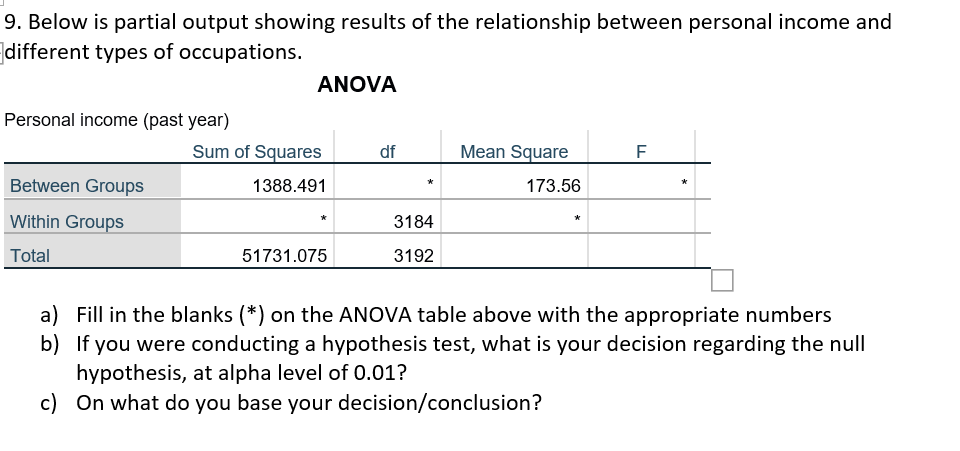
9. Below is partial output showing results of the relationship between personal income and different types of occupations. ANOVA Personal income (past year) Sum of Squares df Mean Square F Between Groups 1388.491 173.56 Within Groups * 3184 Total 51731.075 3192 a) Fill in the blanks (*) on the ANOVA table above with the appropriate numbers b) If you were conducting a hypothesis test, what is your decision regarding the null hypothesis, at alpha level of 0.01? c) On what do you base your decision/conclusion?
Q: House price y is estimated as a function of the square footage of a house x and a dummy variable d…
A:
Q: The table below gives the number of weeks of gestation and the birth weight (in pounds) for a sample…
A: The regression equation is obtained below: x y X^2 Y^2 XY 33 6 1089 36 198 34 6.1 1156 37.21…
Q: given confidence level and values of x and n, find the following. = 44, n=95, confidence level 99%…
A: We have given that, Favorable (X) = 44 and sample size (n) = 95 Then, We will find the 99%…
Q: Determine the number of samples you will choose from a population of 5,200 considering that you…
A: Given: Population size N=5200 Margin of error e=5% Then to find sample size n=??
Q: An initial claim based on previous analyses, which the researcher tries to disprove, reject, or…
A: We have given that the statement about to the hypothesis. Here, need to find out that the correct…
Q: a. Show that Y is a biased estimator of 0 and con b. Find the MSE of Y. c. Find a function of Y that…
A:
Q: Given a normal distribution with µ = 103 and o = 15, and given you select a sample of n = 9,…
A:
Q: In a survey of 2492 adults in a recent year, 1491 say they have made a New Year's resolution…
A: Given
Q: A StatCrunch poll asked people if college was worth the financial investment. They also asked the…
A: Female Male All No 45 57 102 Unsure 100 96 196 Yes 577 401 978 All 722 554 1276
Q: 10 The variance of the prediction error is, a 41.8479 b 43.1422 c 44.4765…
A: For the given data The variance of the prediction error is = ?
Q: The table gives the data of students categorized by gender and major. Physics Biology Majors Math…
A: Given n(Male)=7+12+9=28 n(biology)=9+14=23 n(biology and male)=9
Q: A Markov chain with state space S {1,2} is described by the transition %3D matrix 1-a P 3= where 0 2…
A: Given the transition matrix of the Markov chain with state space S=0,1 as P=1-ααβ1-β
Q: The owner of a popular coffee shop believes that customers who drink espresso are less likely to use…
A: X1=15, n1=50, X2=24, n2=50
Q: Independent random samples selected from two normal populations produced the sample means and…
A:
Q: A surprising number of young adults (ages 19 to 25) still live in their parents' homes. A random…
A: Required conditions: n1>30 n2>30 n1*p1^>=10 n1*(1-p1^)>=10 n2*p2>=10 n2*p2^>=10
Q: A die is weighted in such a way that each of 2, 4, and 6 is twice as likely to come up as each of 1,…
A: Hey there! Thank you for posting the question. Since there are multiple questions posted, we will…
Q: what is μ?
A: here given, n= 529 standard deviation of sampling distribution = 5.28
Q: 3. Assuming that the samples comes from normal distributions, find the margin of error E, given the…
A: Given that
Q: Consider the data set shown. The mean X value is 6 and the mean Y value is 5. X Y 2 8. 5 1 8. 4 9 7…
A:
Q: A simple random sample of 10 items resulted in a sample mean of 10. The population standard…
A: Given that Sample size n =10 Sample mean =10 Population standard deviation =3
Q: full question plzzz(hand written asap
A:
Q: 43. What is the seventh decile? a. 13 b. 14 С. 15 d. 16 44. What is the 80th percentile? a. 13.6 b.…
A:
Q: Contingency Tables default ed No Yes Total Did not complete high school Observed 293 79…
A: Introduction: The output for the chi-square test is given.
Q: The Bureau of Labor Statistics reports that the official unemployment rate for Black people was…
A: Variables are of different types. The correct classification of variables and the identification of…
Q: Q2 A computer used by a 24-hour banking service is supposed to randomly assign each transaction to…
A:
Q: Let grad be a dummy variable for whether a student-athlete at a large university graduates in five…
A: Given model is, grad=-1.17+0.24hsGPA+0.00058SAT+0.0073study Given that hsGPA=3 SAT=1200 The estimate…
Q: Twenty people were nominated to do the push-up challenge. To do this, they must record the number of…
A:
Q: Based on a poll, among adults who regret getting tattoos, 17% say that they were too young when…
A:
Q: Find the probability that a single randomly selected value is less than 962 dollars. P(X < 962) =…
A: CNNBC recently reported that the mean annual cost of auto insurance is 1012 dollars. Assume the…
Q: What is the age distribution of adult shoplifters (21 years of age or older) in supermarkets? The…
A:
Q: A sample of n=30n=30 data values randomly collected from a normally distributed population has…
A: Given that
Q: Problem 2 Dr. 5( g is trying to choose the starting lineup for his fantasy NBA basketball team. The…
A:
Q: data survival O Sheet1 Regression Summary for Dependent Variable: survival (Sheet1 in data_survival)…
A: There are 3 independent variables. It is multiple regression model. We have to write the regression…
Q: How does the Kaplan-Meier approach to estimating the survival function utilize information from…
A:
Q: Use the given data to find the equation of the regression line. Examine the scatterplot and identify…
A: Given information: x y X^2 Y^2 XY 14 19.64 196 385.7296 274.96 8 15.5 64 240.25 124 10…
Q: For the regression equation, Y = X – 1, if the mean for Y is MY = 3, what is the mean for X?
A: It is given that Y=X-1.
Q: What is your current internet speed? 100 responses 1-5mb 26% 6-15m 16-25r 11% 26-50r 50-100 100+m 8%
A: Given: Class Frequency 1-5 8 6-15 11 16-25 39 26-50 26 50-100 11 100+ 5 Total 100
Q: %3D ху xy-(x)7) m = x²- x²y²-xxy b = x²-g2 y XX ху 1 4.6 2 7.1 1 7.1 3 2 9.5 4 19 4 3 11.5 34.5 5 4…
A: Solution-: We have following table: n xi yi xi*xi yi*yi xi*yi 1 0 4.6 0 21.16 0 2 1 7.1 1…
Q: (a) What would be the standard deviation of the sample mean? (b) What is the probability that the…
A:
Q: Hubert paid a total of $3,250 for 250 shares of stock. He sold the stock for $11.70 per share and…
A: The profit is the amount which a dealer gains in a deal. In that case, the amount spent is smaller…
Q: 3. Harper's Index reported that 80% of all supermarket prices end with dhe mmerala So insor9. a…
A: For the given data Point estimate =? EBP =?
Q: In random samples of 900 men and 400 women it is found that 99 men and 36 women suffer from kidney…
A:
Q: What was the z-score for 0.3274? What is σp′?
A: suppose that 43% of people who enter a store will make a purchase. Random samples of people who walk…
Q: For items 41 - 45, Evaluate the following. Show your solution on the space provided. The following…
A:
Q: Using the date 2020, rewrite the following business quotes into APA in-text citation. “If your…
A: APA citation is a standard way of referencing.
Q: A researcher wants to carry out a hypothesis test involving the mean for a sample of n = 20. While…
A: The objective is to interpret the validity of the provided test statistic, for which the hypothesis…
Q: Suppose it is known that the monthly sales volume (V) in units of a given product manufactured by…
A:
Q: How to make a 7 qc tools histogram? Construct a histogram based on the following results obtained…
A: Histogram is data visualization tool used for showing frequencies for interval of values.
Q: An economist collects a simple random sample of 32 teachers salaries in Cititon, and finds a mean of…
A: There are two type of parametric test widely used, they are t test and z test. Both test follows the…
Q: %3D K be a continuous random variable with domain D = [0, 7 and PDF 0 <x < 2, 2 < x < 5, a.x 2a…
A:
Step by step
Solved in 2 steps with 2 images
- A new operator was recently assigned to a crew of workers who perform a certain job. From the records of the number of units of work completed by each worker each day last month, a sample of size five was randomly selected for each of the two experienced workers and the new worker. At the ? = .05 level of significance, does the evidence provide sufficient reason to reject the claim that there is no difference in the amount of work done by the three workers? Workers New A B Units of work (replicates) 10 12 9 10 10 11 9 12 10 9 11 13 10 12 9 (a) Find the test statistic. (Give your answer correct to two decimal places.)(ii) Find the p-value. (Give your answer bounds exactly.) _____< p < ____(b) State the appropriate conclusion. Reject the null hypothesis, there is not significant evidence of a difference in units of work between the workers. Reject the null hypothesis, there is significant evidence of a difference in units of…A new operator was recently assigned to a crew of workers who perform a certain job. From the records of the number of units of work completed by each worker each day last month, a sample of size five was randomly selected for each of the two experienced workers and the new worker. At the ? = .05 level of significance, does the evidence provide sufficient reason to reject the claim that there is no difference in the amount of work done by the three workers? Workers New A B Units of work (replicates) 9 12 10 9 10 11 11 10 10 9 12 13 11 10 11 (a) Find the test statistic. (Give your answer correct to two decimal places.)A new operator was recently assigned to a crew of workers who perform a certain job. From the records of the number of units of work completed by each worker each day last month, a sample of size five was randomly selected for each of the two experienced workers and the new worker. At the ? = .05 level of significance, does the evidence provide sufficient reason to reject the claim that there is no difference in the amount of work done by the three workers? Workers New A B Units of work (replicates) 9 12 10 9 10 11 11 10 10 9 12 13 11 10 11 (a) Find the test statistic. (Give your answer correct to two decimal places.) (ii) Find the p-value. (Give your answer bounds exactly.) This has two bounds: ____________< p < _____________
- A new operator was recently assigned to a crew of workers who perform a certain job. From the records of the number of units of work completed by each worker each day last month, a sample of size five was randomly selected for each of the two experienced workers and the new worker. At the ? = .05 level of significance, does the evidence provide sufficient reason to reject the claim that there is no difference in the amount of work done by the three workers? Workers New A B Units of work (replicates) 8 12 13 8 11 9 10 10 13 8 10 11 11 12 10 (a) Find the test statistic. (Give your answer correct to two decimal places.)(ii) Find the p-value. (Give your answer bounds exactly.) ________< p < ________ (Has two values)A new operator was recently assigned to a crew of workers who perform a certain job. From the records of the number of units of work completed by each worker each day last month, a sample of size five was randomly selected for each of the two experienced workers and the new worker. At the ? = .05 level of significance, does the evidence provide sufficient reason to reject the claim that there is no difference in the amount of work done by the three workers? Workers New A B Units of work (replicates) 11 11 11 11 13 12 10 12 12 10 10 11 11 13 11 (a) Find the test statistic. (Give your answer correct to two decimal places.)(ii) Find the p-value. (Give your answer bounds exactly.) < p < (b) State the appropriate conclusion. Reject the null hypothesis, there is not significant evidence of a difference in units of work between the workers.Reject the null hypothesis, there is significant evidence of a difference in units of work…At the campus-wide meeting, the president of a community college claims that more than 51% of all community college students are female. In a random sample of 128 community college students, 74 were female. Test the president's claim at the 0.01 level of significance. Show STEP 1, STEP 2 and STEP 3&4 Step 5: There ____ sufficient evidence to conclude that________________.
- The U.S. Census Bureau conducts annual surveys to obtain information on the percentage of the voting-age population that is registered to vote. Suppose that 713 employed persons and 613 unemployed persons are independently and randomly selected and that 338 of the employed persons and 244 of the unemployed persons have registered to vote. Can we conclude that the percentage of employed workers ( p1 ), who have registered to vote, exceeds the percentage of unemployed workers ( p2 ), who have registered to vote? Use a significance level of α=0.1 for the test. Step 1 of 6 : State the null and alternative hypotheses for the test. Step 2 of 6 : Find the values of the two sample proportions, pˆ1p^1 and pˆ2p^2. Round your answers to three decimal places. Step 3 of 6 : Compute the weighted estimate of p, p‾p‾. Round your answer to three decimal places. Step 4 of 6 : Compute the value of the test statistic. Round your answer to two decimal places.…When conducting an ANOVA on sbp and genhelth, the p-value is 0.008. Therefore we conclude Group of answer choices reject the null hypothesis at 1% level, mean sbp different for at least one category of genhelth reject the null hypothesis at 5% level, mean sbp different for all categories of genhelth reject the null hypothesis at 1% level, mean sbp different for all categories of genhelth no evidence to reject the null hypothesis of equal meansn a recent court case it was found that during a period of 11 years888people were selected for grand jury duty and39%of them were from the same ethnicity. Among the people eligible for grand jury duty,80.4%were of this ethnicity. Use a0.01significance level to test the claim that the selection process is biased against allowing this ethnicity to sit on the grand jury. Identify the null hypothesis, alternative hypothesis, test statistic, P-value, conclusion about the null hypothesis, and final conclusion that addresses the original claim. Use the P-value method and the normal distribution as an approximation to the binomial distribution.
- A computer company wants to determine if there is a difference in the proportion of defective computer chips in a day’s production from two different production plants, A and B. A quality control specialist takes a random sample of 100 chips from the first hour of production from plant A and determines that there are 12 defective chips. The specialist then takes a random sample of 100 chips from the last hour of production from plant B and determines that there are 10 defective chips. Assuming conditions for inference are met, what is the 90% confidence interval for the true difference in proportions of defective chips from a day’s production between the two plants? Find the z-table here. (0.12 minus 0.10) plus-or-minus 1.96 StartRoot StartFraction 0.12 (1 minus 0.12) Over 100 EndFraction + StartFraction 0.10 (1 minus 0.10) Over 100 EndFraction EndRoot (0.12 minus 0.10) plus-or-minus 1.65 StartRoot StartFraction 0.12 (1 minus 0.12) Over 100 EndFraction + StartFraction 0.10 (1 minus…In a poll conducted by The New York Times and CBS News, 44% of Americans approve of the job that the Supreme Court is doing (The New York Times, June 8, 2012). Assume that this percentage was true for the population of Americans at the time of this poll was conducted. A recent poll of 1265 Americans showed that 38% of them approve of the job that the Supreme Court is doing. At a 2% significance level, can you conclude that the current proportion of Americans who approve of the job that the Supreme Court is doing is different from 44%?Round your answers to two decimal places.zobserved =zcritical left =zcritical right =We (reject, fail to reject) the null hypothesis. We conclude that the current proportion of Americans who approve of the job that the Supreme Court is doing is Choose your answer; We conclude that the current proportion of Americans who approve of the job that the Supreme Court is doing is (not different from, different…A simple random sample of front-seat occupants involved in car crashes is obtained. Among 2913 occupants not wearing seat belts, 38 were killed. Among 7846 occupants wearing seat belts, 13 were killed. Use a 0.01 significance level to test the claim that seat belts are effective in reducing fatalities. Complete parts (a) through (c) below. a. Test the claim using a hypothesis test. Consider the first sample to be the sample of occupants not wearing seat belts and the second sample to be the sample of occupants wearing seat belts. What are the null and alternative hypotheses for the hypothesis test? Identify the test statistic: Identify the P Value: What is the conclusion based on the hypothesis test? The P-value is (less than, greater than) the significance level of a=0.05, so (reject, fail to reject) the null hypothesis. There (is, is not) sufficient evidence to support the claim that the fatality rate is higher for those not wearing seat belts. b. Test the claim by constructing an…