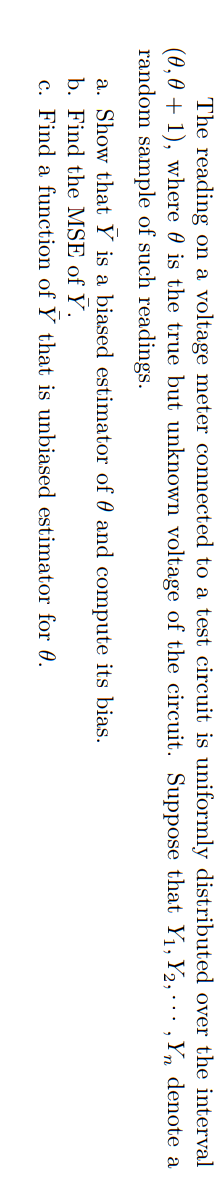
a. Show that Y is a biased estimator of 0 and con b. Find the MSE of Y. c. Find a function of Y that is unbiased estimata


Q: Speed (mph) Frequency 50−54 3 55−59 3 60−64 6 65−69 9 70−74 7 75−79 7 35 The mean is _____. a.…
A:
Q: Of seven coastal lighthouses in the same area, three are designed by a certain well-known architect.…
A: Probability The term "probability" refers to the possibility of something happening. Researchers can…
Q: (a) What percent of the parcels weighed between 8 ounces and 20 ounces? (Round your answer to one…
A:
Q: Prove that MSE(Ô) :
A: Consider, MSEθ^=Eθ^-θ2 Here, θ is parameter and θ^ is an estimator =Eθ^-Eθ^+Eθ^-θ2 add…
Q: A data set contains information on the grams of fat and number of calories in 25 different fast…
A: We have given that Sample size (n) = 25 so, Degree of freedom (df) = n - 2 = 25 -2 = 23
Q: Test the claim that the proportion of men who own cats is larger than 30% at the .10 significance…
A:
Q: A researcher believes that about 73% of the seeds planted with the aid of a new chemical fertilizer…
A: Solution-: Given: n=165,p=0.73 (Or 73%) We want to find, P(more than 117 of the 165 seeds will…
Q: Suppose you are interested in explaining maximum July temperatures in degrees Fahrenheit and…
A:
Q: biologist measured the lengths of hundreds of cuckoo bird eggs. Use the relative frequency…
A: Given that: A frequency in percentage table is given here by using this information we find tha…
Q: Determine whether the alternate hypothesis is left-tailed, right-tailed, or two-tailed. Ho:u = 48…
A: Given,H0:μ=48H1:μ<48
Q: A candy company claims that 11% of the jelly beans in its spring mix are pink. Suppose that the…
A: Given that n=25 , p=11%=0.11 , q=1-p=1-0.11=0.89
Q: Perform the appropriate test of hypothesis to determine whether the new bulb should be used. Use a…
A: It is given that Sample size n = 40 Sample mean M = 505 Sample SD s = 18 Level of significance =…
Q: SP3 Given the matrix a = -1 2 2 2 -0.5 0.5 1 -2 find the inverse using Gauss-Jordan method.
A: Given matrix: -12202-0.50.51-2 We need find the inverse using Gauss-Jordan method.
Q: Consider the following bivariate linear regression model y = a + Bx + u. Suppose that Cov(x, u) > 0,…
A: Solution: 1. From the given information, the bivariate linear regression model is Here,
Q: A A sample of 100 Grade 9 students' ages have been obtained to estimate the mean age of all Grade 9…
A: We have given that Sample mean, x̄ = 16 Population variance ?2 = 16 Sample size n = 100
Q: hand written asap
A:
Q: If the readings are 2 3 4 the average deviation is---- O 5.33 O 3.34 O 2.44 O0.66
A: The objective is to find out the average deviation of the values 2,3 and 4
Q: Teen drivers (those aged 15-19) spend an average of 25 minutes behind the wheel each day. Assume…
A: From the provided information, Mean (µ) = 25 Standard deviation (σ) = 7.6 X~N (25, 7.6)
Q: Z-Distribution Intervals 1. State at least two methods you may use to determine if sampling…
A: 1. a. Z interval for mean: If the population standard deviation is known and sample size is greater…
Q: A researcher wants to carry out a hypothesis test involving the mean for a sample of n = 20. While…
A: The objective is to interpret the validity of the provided test statistic, for which the hypothesis…
Q: 2. Find the 90% confidence interval of the population mean for the income of the executive…
A: (2) The values of sample mean and standard deviation are,
Q: Suppose 226 subjects are treated with a drug that is used to treat pain and 52 of them developed…
A:
Q: formulate the null and alternative hypotheses; b) Determine what test statist. to use; c) Calculate…
A: It ia given that Sample size n = 25 Sample mean M = 86 Sample SD s = 4
Q: Based on the data shown below, calculate the regression line (each value to two decimal places) ˆy=…
A: Solution-: We have following table: X Y 1 11.88 2 15.86 3 17.44 4 20.52 5 22 6 23.18…
Q: The number of sick days taken (per month) by 200 factory workers is summarized below. Number of…
A: As per our guidelines we are supposed to answer only one question per post so I am solving first…
Q: When calculating a confidence interval on a conditional mean for a specific value of X, and a…
A:
Q: The numbers of hours worked (per week) by 400 statistics students are shown below. Number of…
A:
Q: 35% of the squirrels in Cititon Park are gray. What is the probability that, in a random sample of…
A: Given that Sample size n =35 Population proportion p=35%=0.35
Q: How much "statistical significance" do you need to feel confident in regression results? What could…
A: See below
Q: Find the 98% confidence interval for the variance of a normal distribution of the diameters of 9…
A: The diameters of 9 soccer balls; n=9 The sample mean is 22 cm and sample standard deviation 0.5cm…
Q: When performing a hypothesis test to decide whether a predictor variable is useful to make…
A: For the given statement Select the correct choice
Q: A student researcher claims that fewer than 8% of the Junior High School completers will enroll in…
A: Claim: fewer than 8% of the Junior High School completers will enroll in private Senior High…
Q: The average annual cost (in dollars) of tuition and fees at a 22-year college for selected years is…
A: Given data y=78.22x+3166
Q: Find the standard error of the estimate for the difference in mean comfortable room temperatures…
A:
Q: If a card is drawn from a deck of 52 playing cards, what is the probability of getting a face card…
A: Solution
Q: A-E F-J K-O P-T U-Z Total Section 19 16 15 26 6. 82 004 Section 16 13 12 52 005 Section 21 10 8 80…
A: Chi-square test is a nonparametric associational inferential procedure.
Q: B0/1 pt 53 19 O Details A political candidate has asked you to conduct a poll to determine what…
A:
Q: n using SPSS/Minitab
A: Given information: Sodium content of 26 randomly picked canned food. MINITAB From the output, The…
Q: Match the following terms to their symbols Sample Standard deviation 1. n Population mean 2. X…
A: We have given the following symbols
Q: FOR EACH PROBLEM BELOW, a) formulate the null and alternative hypotheses; b) Determine what test…
A: Given that Hypothesized Population Mean (\mu)(μ) = 60006000 Sample Standard Deviation (s)(s) =…
Q: 2. Using the t table, give the confidence coefficients for each of the following. n = 12, 95%…
A: According to guidelines we solve first three subparts only when given multiple subparts.
Q: Which interval is which? Matilda constructed three confidence intervals, all from the same random…
A: When the confidence interval increases the width of the confidence interval will increase condition…
Q: The following data are measures of pulmonary vascular resistance (PVR) in eight lambs before and…
A:
Q: A genetic experiment involving peas yielded one sample of offspring consisting of 435 green peas and…
A: Consider that p as the true proportion of all yellow offspring peas.
Q: 3. Consider the two phrases "fail to reject the null hypothesis" vs. "accept the null hypothesis."…
A: A null hypothesis states that there is no difference between two measurable events or that there is…
Q: standard deck of 52 cards consists of 4 suits: spades, hearts, diamonds and clubs. Each suit…
A:
Q: 11. A bowl contains 25 red balls, 20 green balls, and 5 white balls. If Kaye picks one of these…
A: We have given the statement about the probability of balls 25 red, 20green, 5 white Total = 50 Note:…
Q: A given distribution has a population mean, µ, of 106 and a population standard deviation, ơ, of 15.…
A: It is given that Mean = 106, SD = 15 And value x = 134
Q: In a study of cell phone usage and brain hemispheric dominance, an Internet survey was e-mailed to…
A:
Q: A political candidate has asked you to conduct a poll to determine what percentage of people support…
A:

Step by step
Solved in 4 steps with 4 images

- Let X1, . . . , Xn i.i.d. U([θ1, θ2]), i.e., X1, . . . , Xn are independent and follow a uniform distribution on the interval [θ1, θ2] for θ1, θ2 ∈ R and θ1 < θ2. Find an estimator for θ1 and θ2 using the method of moments.If X1 and X2 constitute a random sample of size n = 2from an exponential population, find the efficiency of 2Y1relative to X, where Y1 is the first order statistic and 2Y1and X are both unbiased estimators of the parameterLet X1,...,Xn be an iid sample from f(x | θ) = θ xθ−1, 0 < x < 1, where the parameter θ is positive. Find the MLE and MOM estimators for θ
- Let X1,...,Xn be an iid sample from f(x | θ) = θxθ−1, 0 < x < 1, where the parameter θ is positive. Find the MLE and MOM estimators for θSuppose X1, . . . , Xn are i.i.d. from a continuous distribution with p.d.f. fθ(x) = 1/θ if 0 ≤ x ≤ θ, where θ > 0 is an unknown parameter. (a) Find E(X1) (b) Find the MME for θ. (c) Compute the variance of your MME from part (a).For 50 randomly selected speed dates, attractiveness ratings by males of their female date partners (x) are recorded along with the attractiveness ratings by females of their male date partners (y); the ratings range from 1 to 10. The 50 paired ratings yield x=6.3, y=6.0, r=−0.228, P-value=0.111, and y=7.81−0.280x. Find the best predicted value of y(attractiveness rating by female of male) for a date in which the attractiveness rating by the male of the female is x=5. Use a 0.10 significance level. The best predicted value of ywhen x=5 is nothing. (Round to one decimal place as needed.)
- For 50 randomly selected speed dates, attractiveness ratings by males of their female date partners (x) are recorded along with the attractiveness ratings by females of their male date partners (y); the ratings range from 1 to 10. The 50 paired ratings yield x=6.3, y=6.0, r=−0.264, P-value=0.063, and y=7.92−0.304x. Find the best predicted value of y (attractiveness rating by female of male) for a date in which the attractiveness rating by the male of the female is x=4. Use a 0.01 significance level. The best predicted value of y when x=4 is __ (Round to one decimal place as needed.)The average normal daily temperature ( in degree Celsius) and the corresponding average monthly precipitation( in inches ) for the month of June are shown below for seven randomly selected cities. Compute for the value of r, complete the table with the needed information. Temperature(x) 30 27 28 32 27 23 18 Precipitation(y) 3.4 1.8 3.5 3.6 3.7 1.5 0.2For 50 randomly selected speed dates, attractiveness ratings by males of their female date partners (x) are recorded along with the attractiveness ratings by females of their male date partners (y); the ratings range from 1 to 10. The 50 paired ratings yield x=6.3, y=5.9, r=−0.256, P-value=0.073, and y=7.73−0.285x. Find the best predicted value of y (attractiveness rating by female of male) for a date in which the attractiveness rating by the male of the female is x=6. Use a 0.01 significance level. The best predicted value of y when x=6 is?
- Suppose μ1 and μ2 are true mean stopping distances at 50 mph for cars of a certain type equipped with two different types of braking systems. The data follows: m = 8, x = 114.6, s1 = 5.03, n = 8, y = 129.3, and s2 = 5.38. Calculate a 95% CI for the difference between true average stopping distances for cars equipped with system 1 and cars equipped with system 2. (Round your answers to two decimal places.) ,For 50 randomly selected speed dates, attractiveness ratings by males of their female date partners (x) are recorded along with the attractiveness ratings by females of their male date partners (y); the ratings range from 1 to 10. The 50 paired ratings yield x=6.4, y=6.0, r=−0.211, P-value=0.142, and y=7.65−0.253x. Find the best predicted value of y(attractiveness rating by female of male) for a date in which the attractiveness rating by the male of the female is x=5. Use a 0.10 significance level.
