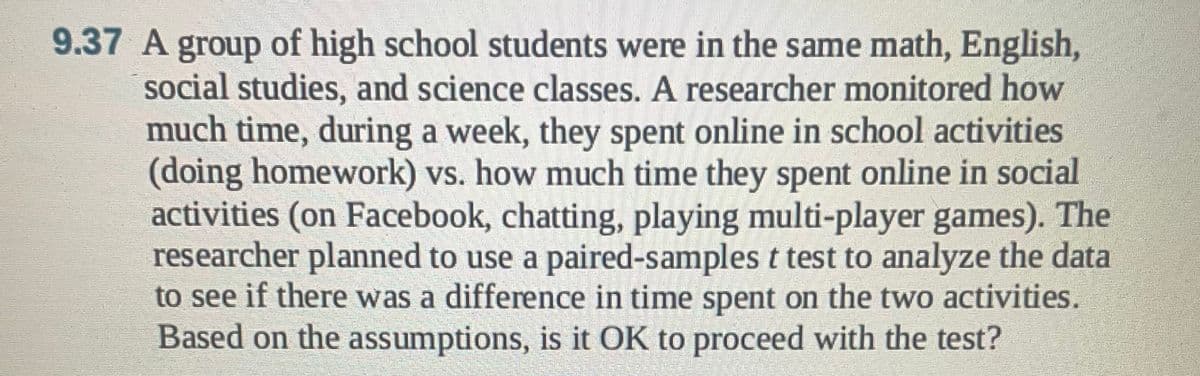
9.37 A group of high school students were in the same math, English, social studies, and science classes. A researcher monitored how much time, during a week, they spent online in school activities (doing homework) vs. how much time they spent online in social activities (on Facebook, chatting, playing multi-player games). The researcher planned to use a paired-samples t test to analyze the data to see if there was a difference in time spent on the two activities. Based on the assumptions, is it OK to proceed with the test?
Q: You randomly select a card from a 52 card deck. Find the probability of selecting a 3 or 7.
A:
Q: You are analyzing a confidence interval using a 95% confidence level in your analysis. You collect a…
A: We have given that, Sample size (n) = 233 and sample proportion (p̂) = 0.423 Then, We will find…
Q: Suppose you a manager for a local car dealership, and you want to use a linear regression model to…
A:
Q: At the beginning of 2018, a survey showed that a country with a total land area of 500,500 square…
A: Given that, at the beginning of 2018, a survey showed that a country with a total land area of…
Q: Suppose you an analyzing a large ANOVA test that yielded a F-statistic of 7.89 and a MSE of 249.97.…
A: Given: F-statistic =7.89 MSE=249.97
Q: A country consists of 20 states. There are 522 seats in the Congress which are to be apportioned…
A: seats 522 population SQ AUQ WRQ MQ for A MQ for W AMR WMR AD DS A 413875…
Q: Suppose you an analyzing a large ANOVA test that yielded a SST of 3256.28, along with a MSE of…
A: Given that SST = 3256.28 MSE = 17.74 Number of groups (k) = 10 Number of observations per group =…
Q: Suppose you are a market analyst for a company that produces headphones, and want to determine if…
A: For the given information, we need to solve for ANOVA.
Q: 1. A researcher claims that 85% of college students would rather spend their extra money for…
A: Since you have posted a question with multiple sub-parts, we will solve first three subparts for…
Q: Example 20.10 Let us take another example. Table 20.12 gives indices with two different base-years,…
A:
Q: Example 20.11 Suppose we are given an index number series as follows: Year 1995 1996 1997 1998 Index…
A:
Q: The use of incorrect statistical method may cause spurious association. A. True B. False
A: Spurious association is kind of pseudo cause and effect association between two variables.
Q: 3. Ho: μ = 67.5 Ha: μ 70 Critical Value: α = n = 20 a = 0.05 n = 15 α = 0.01 n = 65 o=unknown σ =…
A: We need to find the critical value and draw the rejection region for each hypothesis test based on…
Q: Use the graph to calculate the probabilities of the events given below. (a) (at most three lines are…
A: We have given that a mail-order computer business has six telephone lines. The random variable X…
Q: In 2016 the Better Business Bureau settled 80% of complaints they received in the United States.…
A:
Q: Here are measurements (in millimeters) of a critical dimension on an SRS of 8 of the more than 200…
A: In question, Given that measurements (in millimeters) of a critical dimension on an SRS of 8 of the…
Q: The following table lists the income tax rates for a single person earning $30,000 p State A B C DE…
A:
Q: Consider the following hypotheses: He: H 155 HA: < 155 The population is normally distributed. A…
A: Firstly we have to calculate the sample mean and sample SD for the given data.
Q: You are a process engineer for a company that manufactures widgets. A particular machine at your…
A:
Q: 4. Zoom meeting rooms each have a unique Meeting ID. ID's are an arrangement of 11 numerical digits…
A: Total number of digits to form a meeting ID is 11 from 0 to 9. Here we are required to find the…
Q: W .00 110H₂:μ₁ sulav μ₂=0 H₁: μ₁ −μ₂ #0 drogeri belis-owl a botavanomab ow.alqmsxs gribo de al eal…
A: Given that : Sample 1 n1 = 80 m1 = 104 ?1 = 8.4 Sample 2 n2 = 70 m2 = 106 ?2 = 7.6 By using the two…
Q: Make a regression that will enable you to predict BAC from the number of beers consumed. What is the…
A:
Q: You are analyzing a confidence interval using a 90% confidence level in your analysis. You collect a…
A: Obtain the upper bound of the 90% confidence interval for the population proportion. The upper bound…
Q: You are a sales manager for a grocery store, and you want to see if the introduction of a new sales…
A: Given that Sample sizes n1=24 , n2=24 S1=47.15 s2=75.46
Q: Consider the following hypotheses: He: 159 HA: 159 A sample of 75 observations results in a sample…
A:
Q: Suppose that an experimenter tossed three balanced coins. He defined X₁, to denote the number of…
A:
Q: ad Is the difference between the mean annual salaries of statisticians in Region 1 and Region 2 more…
A: Given n1=46 n2=43
Q: Consider the following hypotheses: He: 159 HA: 159 A sample of 75 observations results in a sample…
A: Given n=75, sample mean x̄=146, population standard deviations σ=3
Q: A study reveals that 73% senior high school students prefer to stay at home and do household chores…
A: Given that : P0 = 73 % n = 300 x = 234 By using the one sample proportion test to solve this…
Q: and get answers to questions as they prepare their tax returns. In recent years, the IRS has been…
A:
Q: In order to conduct a hypothesis test for the population proportion, you sample 320 observations…
A: We have given thatn = 320x = 128p̂ = x/n = 128/328 = 0.40p = 0.45α = 0.05The null and alternative…
Q: A manager wishes to determine whether the mean times required to complete a certain task differ for…
A: The choice of the appropriate test statistic depends on the type of research question one is…
Q: If P(A)=0.3 and P(B)=0.6, find each probability a) P(A and B) if A and B are independent events…
A:
Q: During one shift, the express lane clerk recorded how many times customers violated the "10 items or…
A: The histogram shows the number of items over the limit each violator placed on the conveyor belt.
Q: A case-control (or retrospective) study was conducted to investigate a relationship between the…
A: Null Hypothesis: H0: The variables the colors of helmets worn and injuries are independent.…
Q: Suppose the age that children learn to walk is normally distributed with mean 12 months and standard…
A: As per our guidelines we are suppose to answer three sub parts . Given,mean(μ)=12standard…
Q: A population N=5 consists of the following values 13, 15, 17, 19, and 21. Random Sample of size n-3…
A: Data given 13,15,17,19,21
Q: You are the manager of a local cinema, and want to investigate how much the average customer spends…
A: Givensample size(n)=21Mean(x)=12.23standard deviation(s)=2.88confidence interval =95%
Q: Given a standardized normal distribution (with a mean of 0 and a standard deviation of 1), determine…
A: The standard normal variable have a mean of value 0 and sd of 1 It is represented by Z.
Q: Consider a drug that is used to help prevent blood clots in certain patients. In clinical trials,…
A: Given claim: 3% of users develop nausea. Null Hypothesis: H0: p=0.03 Alternative Hypothesis: H1: p…
Q: From the SAS output, interpret the 95% confidence interval for the true average difference in dental…
A: 95% confidence interval for the true average difference in dental measurements in the population of…
Q: As part of a university club, you decide to investigate how much other students at the university…
A: Given that Sample size n =27 Sample mean =803.95 Sample standard deviation =157.20
Q: He: p = 0.45; HA: P < 0.45. a-1. Calculate the value of the test statistic. (Negative value should…
A: Given that Sample size n =320 Favorable cases x =128 Sample proportion p^=x/n =128/320 =0.4
Q: Suppose that an experimenter tossed three balanced coins. He defined X1, to denote the number of…
A:
Q: You want to buy a washing machine, and a salesperson tells you that the mean repair costs for Model…
A: The level of significance is 0.01.
Q: Can you show how the -x^2 was found in this integral? I dont understand how this was found. I am…
A: We need to show, how the -x2 was found in this integral? I
Q: ou are a manager for a local convenience store. You want to determin proportion of your customers…
A: Given that Margin of error =E=6.50%=0.0650 99% confidence.
Q: An auto shop wants to examine the proportion of customers that have to return after an appointment.…
A:
Q: A company providing mobile phone service plans has a list of phone numbers for their 125,000…
A:
Q: *** Please answer 6-8 *** Use the samples to find the mean completion time of the for the male…
A: Given Information: For Female runners: x¯1=31.490, s1=0.960, n1=18 For Male runners: x¯2=27.955,…
Step by step
Solved in 2 steps
- List the sample space of each experiment. Tossing three coinsList the sample space of each experiment. Picking a one-digit numberA random sample of n1 = 148 people ages 16 to 19 were taken from the island of Oahu, Hawaii, and 14 were found to be high school dropouts. Another random sample of n2 = 125 people ages 16 to 19 were taken from Sweetwater County, Wyoming, and 5 were found to be high school dropouts. Do these data indicate that the population proportion of high school dropouts on Oahu is different (either way) from that of Sweetwater County? Use a 1% level of significance.
- A random sample of n1 = 157 people ages 16 to 19 were taken from the island of Oahu, Hawaii, and 12 were found to be high school dropouts. Another random sample of n2 = 129 people ages 16 to 19 were taken from Sweetwater County, Wyoming, and 6 were found to be high school dropouts. Do these data indicate that the population proportion of high school dropouts on Oahu is different (either way) from that of Sweetwater County? Use a 1% level of significance. (a) What is the level of significance? What is the value of the sample test statistic? (Test the difference p1 − p2. Do not use rounded values. Round your final answer to two decimal places.) (c) Find (or estimate) the P-value. (Round your answer to four decimal places.)A random sample of n1 = 157 people ages 16 to 19 were taken from the island of Oahu, Hawaii, and 12 were found to be high school dropouts. Another random sample of n2 = 129 people ages 16 to 19 were taken from Sweetwater County, Wyoming, and 6 were found to be high school dropouts. Do these data indicate that the population proportion of high school dropouts on Oahu is different (either way) from that of Sweetwater County? Use a 1% level of significance. (a) What is the level of significance? (b)What is the value of the sample test statistic? (Test the difference p1 − p2. Do not use rounded values. Round your final answer to two decimal places.) (c) Find (or estimate) the P-value. (Round your answer to four decimal places.)A random sample of n1 = 149 people ages 16 to 19 were taken from the island of Oahu, Hawaii, and 8 were found to be high school dropouts. Another random sample of n2 = 123 people ages 16 to 19 were taken from Sweetwater County, Wyoming, and 10 were found to be high school dropouts. Do these data indicate that the population proportion of high school dropouts on Oahu is different (either way) from that of Sweetwater County? Use a 1% level of significance. (a) What is the level of significance? .01 (b) State the null and alternate hypotheses.H0: p1 = p2; H1: p1 ≠ p2 (c) What sampling distribution will you use? What assumptions are you making? (A) The standard normal. The number of trials is sufficiently large. (B)The Student's t. The number of trials is sufficiently large. (C)The standard normal. We assume the population distributions are approximately normal. (D)The Student's t. We assume the population distributions are approximately normal. (d) What is the value of the sample…
- A random sample of n1 = 154 people ages 16 to 19 were taken from the island of Oahu, Hawaii, and 11 were found to be high school dropouts. Another random sample of n2 = 136 people ages 16 to 19 were taken from Sweetwater County, Wyoming, and 5 were found to be high school dropouts. Do these data indicate that the population proportion of high school dropouts on Oahu is different (either way) from that of Sweetwater County? Use a 1% level of significance. 1. What is the value of the sample test statistic? (Test the difference p1 − p2. Do not use rounded values. Round your final answer to two decimal places.) 2. Find (or estimate) the P-value. (Round your answer to four decimal places.)dults aged 18 years old and older were randomly selected for a survey on obesity. Adults are considered obese if their body mass index (BMI) is at least 30. The researchers wanted to determine if the proportion of southern women who are obese is less than the proportion of southern men who are obese. The results are shown in the table below. Test at the 1% level of significance. Number who are obese Sample size Men 42,773 155,525 Women 67,176 248,775 a.State the distribution to use for the test. (Round your answers to five decimal places. b. What is the test statistic c. Conduct a Hypothesis TestA travel agency is interested in finding out if different age groups frequent different Spring Break destinations, in order to better target the appropriate audiences. A random sample of college Spring Break vacationers produces the results given in the table below. Is there enough evidence at the 0.025 level of significance to show that there is a relationship between age (by college classification) and destination? Observed Sample of College Students Beach Mountains City Home Total Freshman 28 17 20 22 87 Sophomore 24 14 15 3 56 Junior 24 15 17 15 71 Senior 10 12 3 12 37 Total 86 58 55 52 251 Step 3 of 4: Compute the value of the test statistic. Round your answer to three decimal places, if necessary. (Note: If calculating by hand, be sure to use at least six decimal places in numbers for all intermediate calculations to ensure accuracy of the result.) Step 4 of 4: Draw a conclusion and interpret the decision
- A company that manufacturers wooden products (e.g. garden furniture, ladders, benches) regularly maintains its lathe machines, which are used for cutting and shaping The manager would like to know whether the cost of machine maintenance is related to the age of the machines. For a random sample of 12 lathe machines in the company’s factory, the annual maintenance cost (in R100s) and age of each machine was recorded. Machine Age (years) Annual cost (Rand) 1 4 45 2 3 20 3 3 38 4 8 65 5 6 58 6 7 50 7 1 16 8 1 22 9 5 38 19 2 26 11 4 30 12 6 35 Identify the independent variable and the dependent Show the data graphically in a scatter plot. What relationship is observed? Calculate the correlation coefficient between the age of lathe machines and their annual maintenance costs. Comment on the strength of the Is the correlation statistically significant? Test at the 5%…An insurance company crashed four cars in succession at 5 miles per hour. The cost of repair for each of the four crashes was $421, $469, $416, $232 Compute the range, sample variance, and sample standard deviation cost of repair.A recent poll revealed the political affiliations of 237 Americans, along with the region of the country in which they reside. Democrat Independent Republican Northwest 14 12 20 Southeast 29 23 49 West 35 18 37 To test whether the region of residence and political affiliation were related, one of the pollsters computed a chi-square statistic, ?2=2.7245, with four degrees of freedom and set an alpha (?) level of 0.05. Determine the ?-value of the chi-square statistic in this test for independence and report it to at least three decimal places. You will need to use some kind of software (statistical package or calculator that does statistical computations) to get the ?-value that precisely. P =