A case-control (or retrospective) study was conducted to investigate a relationship between the colors of helmets worn by motorcycle drivers and whether they are injured or killed in a crash. Results are given in the accom significance level, test the claim that injuries are independent of helmet color. Color of Helmet White Yellow 331 32 Red Black 482 Blue Controls (not injured) 159 100 Cases (injured or 211 109 8 65 47 killed) Click here to view the chi-square distribution table
A case-control (or retrospective) study was conducted to investigate a relationship between the colors of helmets worn by motorcycle drivers and whether they are injured or killed in a crash. Results are given in the accom significance level, test the claim that injuries are independent of helmet color. Color of Helmet White Yellow 331 32 Red Black 482 Blue Controls (not injured) 159 100 Cases (injured or 211 109 8 65 47 killed) Click here to view the chi-square distribution table

MATLAB: An Introduction with Applications
6th Edition
ISBN:9781119256830
Author:Amos Gilat
Publisher:Amos Gilat
Chapter1: Starting With Matlab
Section: Chapter Questions
Problem 1P

Related questions
Question
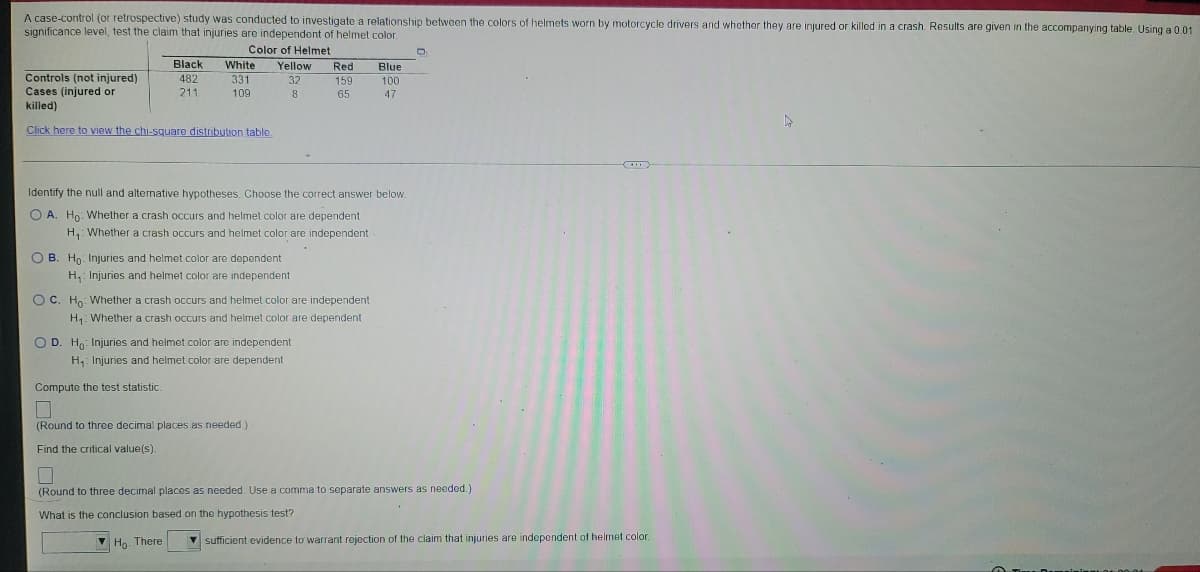
Transcribed Image Text:A case-control (or retrospective) study was conducted to investigate a relationship between the colors of helmets worn by motorcycle drivers and whether they are injured or killed in a crash. Results are given in the accompanying table. Using a 0.01
significance level, test the claim that injuries are independent of helmet color.
D
Black
Color of Helmet
Yellow
32
Blue
White
331
Controls (not injured)
Red
159
482
100
Cases (injured or
211
109
8
65
47
killed)
Click here to view the chi-square distribution table.
Identify the null and alternative hypotheses. Choose the correct answer below.
O A. Ho: Whether a crash occurs and helmet color are dependent
H₁: Whether a crash occurs and helmet color are independent
OB. Ho: Injuries and helmet color are dependent
H₁: Injuries and helmet color are independent
OC. Ho: Whether a crash occurs and helmet color are independent
H₁: Whether a crash occurs and helmet color are dependent
O D. Ho: Injuries and helmet color are independent
H₁: Injuries and helmet color are dependent
Compute the test statistic.
(Round to three decimal places as needed.)
Find the critical value(s).
(Round to three decimal places as needed. Use a comma to separate answers as needed.).
What is the conclusion based on the hypothesis test?
Ho. There
sufficient evidence to warrant rejection of the claim that injuries are independent of helmet color.
Expert Solution
This question has been solved!
Explore an expertly crafted, step-by-step solution for a thorough understanding of key concepts.

This is a popular solution!

Trending now
This is a popular solution!

Step by step
Solved in 3 steps

Recommended textbooks for you
MATLAB: An Introduction with Applications
Statistics
ISBN:
9781119256830
Author:
Amos Gilat
Publisher:
John Wiley & Sons Inc

Probability and Statistics for Engineering and th…
Statistics
ISBN:
9781305251809
Author:
Jay L. Devore
Publisher:
Cengage Learning

Statistics for The Behavioral Sciences (MindTap C…
Statistics
ISBN:
9781305504912
Author:
Frederick J Gravetter, Larry B. Wallnau
Publisher:
Cengage Learning
MATLAB: An Introduction with Applications
Statistics
ISBN:
9781119256830
Author:
Amos Gilat
Publisher:
John Wiley & Sons Inc
Probability and Statistics for Engineering and th…
Statistics
ISBN:
9781305251809
Author:
Jay L. Devore
Publisher:
Cengage Learning
Statistics for The Behavioral Sciences (MindTap C…
Statistics
ISBN:
9781305504912
Author:
Frederick J Gravetter, Larry B. Wallnau
Publisher:
Cengage Learning

Elementary Statistics: Picturing the World (7th E…
Statistics
ISBN:
9780134683416
Author:
Ron Larson, Betsy Farber
Publisher:
PEARSON

The Basic Practice of Statistics
Statistics
ISBN:
9781319042578
Author:
David S. Moore, William I. Notz, Michael A. Fligner
Publisher:
W. H. Freeman

Introduction to the Practice of Statistics
Statistics
ISBN:
9781319013387
Author:
David S. Moore, George P. McCabe, Bruce A. Craig
Publisher:
W. H. Freeman