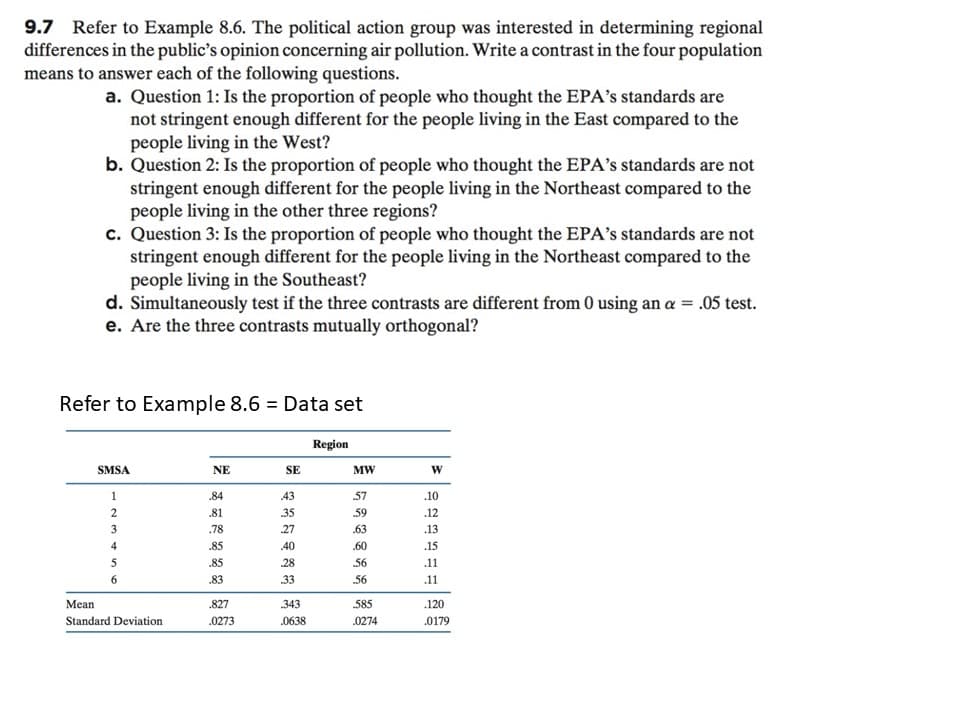
9.7 Refer to Example 8.6. The political action group was interested in determining regional differences in the public's opinion concerning air pollution. Write a contrast in the four population means to answer each of the following questions a. Question 1: Is the proportion of people who thought the EPA's standards are not stringent enough different for the people living in the East compared to the people living in the West? b. Question 2: Is the proportion of people who thought the EPA's standards are not stringent enough different for the people living in the Northeast compared to the people living in the other three regions? c. Question 3: Is the proportion of people who thought the EPA's standards are not stringent enough different for the people living in the Northeast compared to the people living in the Southeast? d. Simultaneously test if the three contrasts are different from 0 using an α e. Are the three contrasts mutually orthogonal? .05 test. Refer to Example 8.6 Data set Region SMSA NE SE .81 78 10 .12 .13 .60 56 56 Mean Standard Deviation 343 .0273 0274 .0179
9.7 Refer to Example 8.6. The political action group was interested in determining regional differences in the public's opinion concerning air pollution. Write a contrast in the four population means to answer each of the following questions a. Question 1: Is the proportion of people who thought the EPA's standards are not stringent enough different for the people living in the East compared to the people living in the West? b. Question 2: Is the proportion of people who thought the EPA's standards are not stringent enough different for the people living in the Northeast compared to the people living in the other three regions? c. Question 3: Is the proportion of people who thought the EPA's standards are not stringent enough different for the people living in the Northeast compared to the people living in the Southeast? d. Simultaneously test if the three contrasts are different from 0 using an α e. Are the three contrasts mutually orthogonal? .05 test. Refer to Example 8.6 Data set Region SMSA NE SE .81 78 10 .12 .13 .60 56 56 Mean Standard Deviation 343 .0273 0274 .0179

Glencoe Algebra 1, Student Edition, 9780079039897, 0079039898, 2018
18th Edition
ISBN:9780079039897
Author:Carter
Publisher:Carter
Chapter10: Statistics
Section: Chapter Questions
Problem 13PT

Related questions

Concept explainers
Contingency Table
A contingency table can be defined as the visual representation of the relationship between two or more categorical variables that can be evaluated and registered. It is a categorical version of the scatterplot, which is used to investigate the linear relationship between two variables. A contingency table is indeed a type of frequency distribution table that displays two variables at the same time.
Binomial Distribution
Binomial is an algebraic expression of the sum or the difference of two terms. Before knowing about binomial distribution, we must know about the binomial theorem.
Topic Video
Question
9.7 Question attached in picture.
Transcribed Image Text:9.7 Refer to Example 8.6. The political action group was interested in determining regional
differences in the public's opinion concerning air pollution. Write a contrast in the four population
means to answer each of the following questions
a. Question 1: Is the proportion of people who thought the EPA's standards are
not stringent enough different for the people living in the East compared to the
people living in the West?
b. Question 2: Is the proportion of people who thought the EPA's standards are not
stringent enough different for the people living in the Northeast compared to the
people living in the other three regions?
c. Question 3: Is the proportion of people who thought the EPA's standards are not
stringent enough different for the people living in the Northeast compared to the
people living in the Southeast?
d. Simultaneously test if the three contrasts are different from 0 using an α
e. Are the three contrasts mutually orthogonal?
.05 test.
Refer to Example 8.6 Data set
Region
SMSA
NE
SE
.81
78
10
.12
.13
.60
56
56
Mean
Standard Deviation
343
.0273
0274
.0179
Expert Solution
This question has been solved!
Explore an expertly crafted, step-by-step solution for a thorough understanding of key concepts.

This is a popular solution!

Trending now
This is a popular solution!

Step by step
Solved in 6 steps with 2 images

Knowledge Booster


Learn more about
Need a deep-dive on the concept behind this application? Look no further. Learn more about this topic, statistics and related others by exploring similar questions and additional content below.Recommended textbooks for you
Glencoe Algebra 1, Student Edition, 9780079039897…
Algebra
ISBN:
9780079039897
Author:
Carter
Publisher:
McGraw Hill
Glencoe Algebra 1, Student Edition, 9780079039897…
Algebra
ISBN:
9780079039897
Author:
Carter
Publisher:
McGraw Hill