The director of library services at a college did a survey of types of books (by subject) in the circulation library. Then she used library records to take a random sample of 888 books checked out last term and classified the books in the sample by subject. The results are shown below. Percent of Books on Subject in Circulation Library on This Subject Number of Books in Subject Area Sample on This Subject Business 32% 25% 20% 256 215 222 Humanities Natural Science 15% 8% Social Science 111 All other subjects 84 Using a 5% level of significance, test the claim that the subject distribution of books in the library fits the distribution of books checked out by students. fa) What ic the lo ionificanco?
The director of library services at a college did a survey of types of books (by subject) in the circulation library. Then she used library records to take a random sample of 888 books checked out last term and classified the books in the sample by subject. The results are shown below. Percent of Books on Subject in Circulation Library on This Subject Number of Books in Subject Area Sample on This Subject Business 32% 25% 20% 256 215 222 Humanities Natural Science 15% 8% Social Science 111 All other subjects 84 Using a 5% level of significance, test the claim that the subject distribution of books in the library fits the distribution of books checked out by students. fa) What ic the lo ionificanco?

Holt Mcdougal Larson Pre-algebra: Student Edition 2012
1st Edition
ISBN:9780547587776
Author:HOLT MCDOUGAL
Publisher:HOLT MCDOUGAL
Chapter7: Percents
Section7.1: Percents And Fractions
Problem 57E

Related questions

Topic Video
Question
Transcribed Image Text:Content
A Math 2250 Unit 4 Post Test Re X
b My Questions | bartleby
x +
->
webassign.net/web/Student/Assignment-Responses/last?dep=24515412
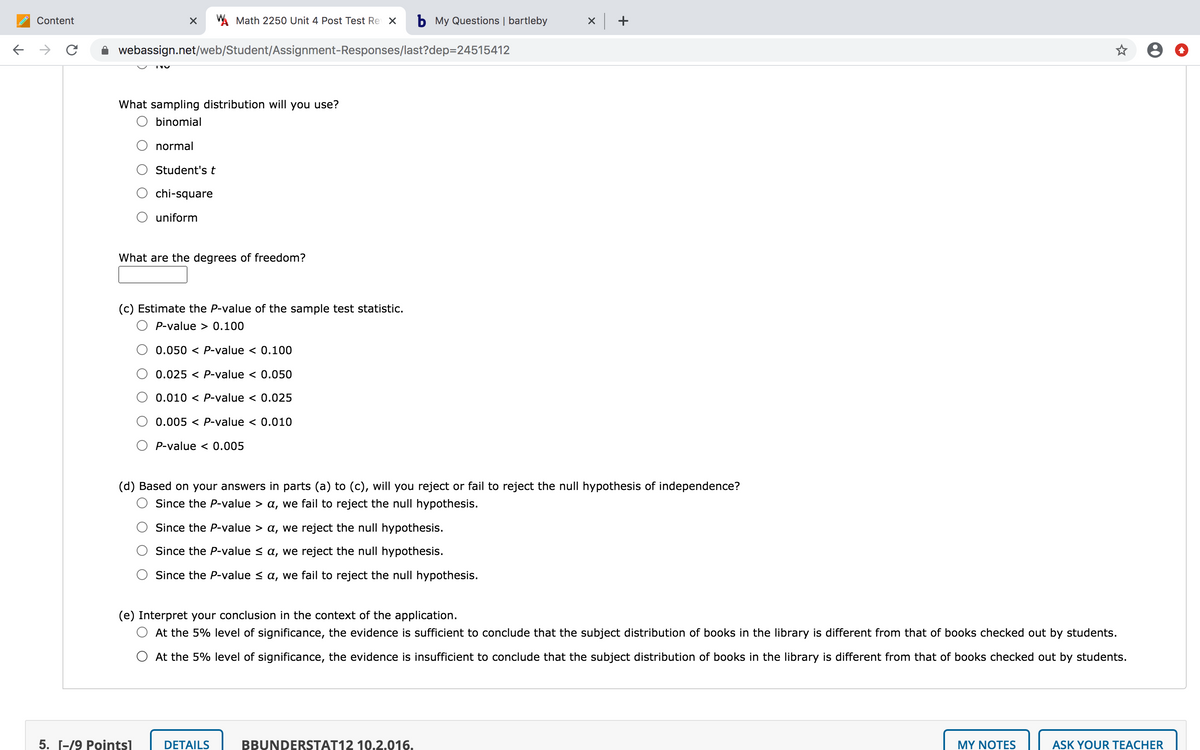
What sampling distribution will you use?
O binomial
normal
Student's t
chi-square
uniform
What are the degrees of freedom?
(c) Estimate the P-value of the sample test statistic.
P-value > 0.100
0.050 < P-value < 0.100
0.025 < P-value < 0.050
0.010 < P-value < 0.025
0.005 < P-value < 0.010
P-value < 0.005
(d) Based on your answers in parts (a) to (c), will you reject or fail to reject the null hypothesis of independence?
Since the P-value > a, we fail to reject the null hypothesis.
Since the P-value > a, we reject the null hypothesis.
Since the P-value < a, we reject the null hypothesis.
Since the P-value < a, we fail to reject the null hypothesis.
(e) Interpret your conclusion in the context of the application.
At the 5% level of significance, the evidence is sufficient to conclude that the subject distribution of books in the library is different from that of books checked out by students.
O At the 5% level of significance, the evidence is insufficient to conclude that the subject distribution of books in the library is different from that of books checked out by students.
5. Г-/9 Рointsl
DETAILS
BBUNDERSTAT12 10.2.016.
MY NOTES
ASK YOUR TEACHER
Transcribed Image Text:Content
A Math 2250 Unit 4 Post Test Re X
b My Questions | bartleby
x +
webassign.net/web/Student/Assignment-Responses/last?dep=24515412
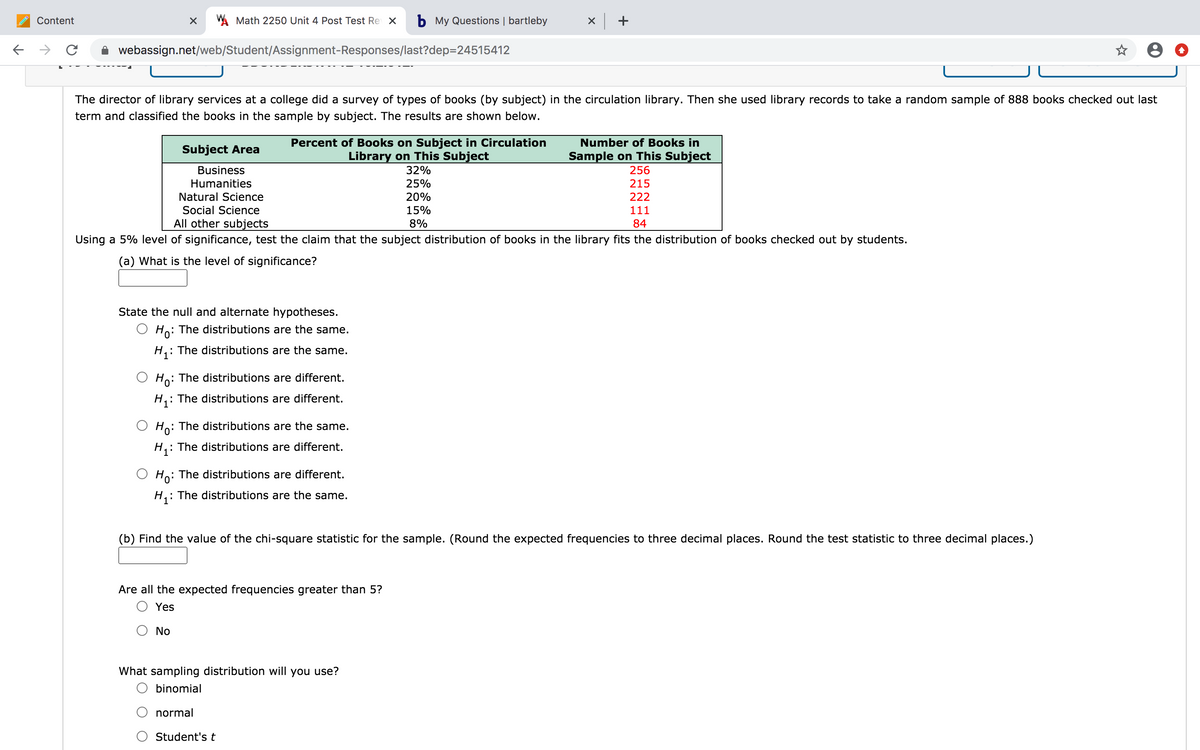
The director of library services at a college did a survey of types of books (by subject) in the circulation library. Then she used library records to take a random sample of 888 books checked out last
term and classified the books in the sample by subject. The results are shown below.
Percent of Books on Subject in Circulation
Library on This Subject
Number of Books in
Subject Area
Sample on This Subject
256
Business
32%
Humanities
25%
215
Natural Science
20%
222
Social Science
15%
111
All other subjects
8%
84
Using a 5% level of significance, test the claim that the subject distribution of books in the library fits the distribution of books checked out by students.
(a) What is the level of significance?
State the null and alternate hypotheses.
O Ho: The distributions are the same.
: The distributions are the same.
O Ho: The distributions are different.
: The distributions are different.
: The distributions are the same.
H,: The distributions are different.
Ho: The distributions are different.
: The distributions are the same.
(b) Find the value of the chi-square statistic for the sample. (Round the expected frequencies to three decimal places. Round the test statistic to three decimal places.)
Are all the expected frequencies greater than 5?
Yes
No
What sampling distribution will you use?
O binomial
normal
Student's t
Expert Solution
This question has been solved!
Explore an expertly crafted, step-by-step solution for a thorough understanding of key concepts.

This is a popular solution!

Trending now
This is a popular solution!

Step by step
Solved in 3 steps with 3 images

Knowledge Booster


Learn more about
Need a deep-dive on the concept behind this application? Look no further. Learn more about this topic, statistics and related others by exploring similar questions and additional content below.Recommended textbooks for you
Holt Mcdougal Larson Pre-algebra: Student Edition…
Algebra
ISBN:
9780547587776
Author:
HOLT MCDOUGAL
Publisher:
HOLT MCDOUGAL

Glencoe Algebra 1, Student Edition, 9780079039897…
Algebra
ISBN:
9780079039897
Author:
Carter
Publisher:
McGraw Hill

Algebra and Trigonometry (MindTap Course List)
Algebra
ISBN:
9781305071742
Author:
James Stewart, Lothar Redlin, Saleem Watson
Publisher:
Cengage Learning
Holt Mcdougal Larson Pre-algebra: Student Edition…
Algebra
ISBN:
9780547587776
Author:
HOLT MCDOUGAL
Publisher:
HOLT MCDOUGAL
Glencoe Algebra 1, Student Edition, 9780079039897…
Algebra
ISBN:
9780079039897
Author:
Carter
Publisher:
McGraw Hill
Algebra and Trigonometry (MindTap Course List)
Algebra
ISBN:
9781305071742
Author:
James Stewart, Lothar Redlin, Saleem Watson
Publisher:
Cengage Learning

Algebra & Trigonometry with Analytic Geometry
Algebra
ISBN:
9781133382119
Author:
Swokowski
Publisher:
Cengage

College Algebra
Algebra
ISBN:
9781305115545
Author:
James Stewart, Lothar Redlin, Saleem Watson
Publisher:
Cengage Learning

Intermediate Algebra
Algebra
ISBN:
9781285195728
Author:
Jerome E. Kaufmann, Karen L. Schwitters
Publisher:
Cengage Learning