90 Part Two Planning Future Financial Performance TABLE 3.5 Forecasting with a Spreadsheet: Pro Forma Financial Forecast for R&E Supplies, Inc., December 31, 2018 ($ thousands) 2017 Actual $20,613 Year 2018 2019 Net sales 4. Growth rate in net sales 25.0% Cost of goods sold/net sales Gen., sell., and admin. expenses/net sales Long-term debt Current portion long-term debt 9. 86.0% 6. 12.0% 2$ 24 760 $660 100 $100 Interest rate 10.0% 10 11 Dividend/earnings after tax Current assets/net sales Tax rate 45.0% 50.0% 12 29.0% 13 14 Net fixed assets $280 Current liabilities/net sales 14.5% Owners' equity 16 INCOME STATEMENT 15 $1,730 17 Equations 2018 Forecast Forecast 18 Year 2018 2019 19 Net sales = B3 + B3*C4 $25,766 Cost of goods sold Gross profit 20 = C5*C19 = C19 - C2O 22,159 21 3,607 22 Gen., sell., and admin. exp. = C6*C19 = C9*(C7 + C8 + C40) = C21 - C22- C23 = C10 C24 3,092 23 Interest expense 231 24 Earnings before tax 285 25 Tax 128 26 Earnings after tax 27 Dividends paid = C24 - C25 156 = C11 C26 = C26 – C27 78 28 Additions to retained earnings 29 78 30 BALANCE SHEET 31 Current assets = C12*C19 7,472 32 Net fixed assets = C13 33 Total assets 280 = C31 + C32 34 7,752 Current liabilities 36 Long-term debt Owners' equity 35 = C14*C19 = C7 = B15 + C28 = C35 + C36 + C37 3,736 37 660 38 39 equity 1,808 6,204 Total liabilities and owners' 40 EXTERNAL FUNDING REQUIRED = C33 - C38 $ 1,548
90 Part Two Planning Future Financial Performance TABLE 3.5 Forecasting with a Spreadsheet: Pro Forma Financial Forecast for R&E Supplies, Inc., December 31, 2018 ($ thousands) 2017 Actual $20,613 Year 2018 2019 Net sales 4. Growth rate in net sales 25.0% Cost of goods sold/net sales Gen., sell., and admin. expenses/net sales Long-term debt Current portion long-term debt 9. 86.0% 6. 12.0% 2$ 24 760 $660 100 $100 Interest rate 10.0% 10 11 Dividend/earnings after tax Current assets/net sales Tax rate 45.0% 50.0% 12 29.0% 13 14 Net fixed assets $280 Current liabilities/net sales 14.5% Owners' equity 16 INCOME STATEMENT 15 $1,730 17 Equations 2018 Forecast Forecast 18 Year 2018 2019 19 Net sales = B3 + B3*C4 $25,766 Cost of goods sold Gross profit 20 = C5*C19 = C19 - C2O 22,159 21 3,607 22 Gen., sell., and admin. exp. = C6*C19 = C9*(C7 + C8 + C40) = C21 - C22- C23 = C10 C24 3,092 23 Interest expense 231 24 Earnings before tax 285 25 Tax 128 26 Earnings after tax 27 Dividends paid = C24 - C25 156 = C11 C26 = C26 – C27 78 28 Additions to retained earnings 29 78 30 BALANCE SHEET 31 Current assets = C12*C19 7,472 32 Net fixed assets = C13 33 Total assets 280 = C31 + C32 34 7,752 Current liabilities 36 Long-term debt Owners' equity 35 = C14*C19 = C7 = B15 + C28 = C35 + C36 + C37 3,736 37 660 38 39 equity 1,808 6,204 Total liabilities and owners' 40 EXTERNAL FUNDING REQUIRED = C33 - C38 $ 1,548

Chapter12: Corporate Valuation And Financial Planning
Section: Chapter Questions
Problem 12SP

Related questions
Question
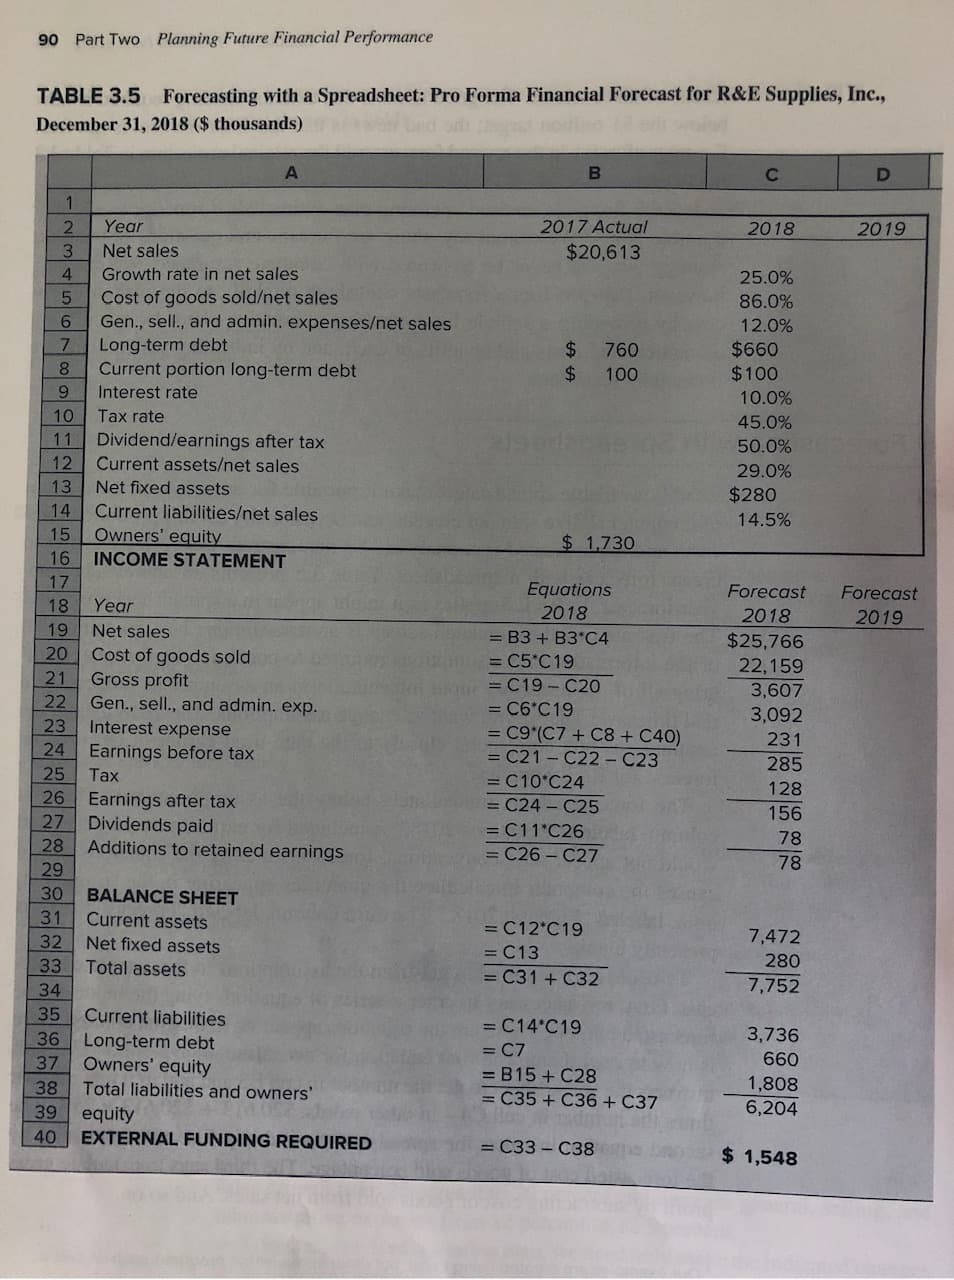
Table 3.5 presents a computer spreadsheet for estimating R&E Supplies’ external financing required for 2018. The text mentions that with modifications to the equations for equity and net sales, the
Transcribed Image Text:90
Part Two Planning Future Financial Performance
TABLE 3.5 Forecasting with a Spreadsheet: Pro Forma Financial Forecast for R&E Supplies, Inc.,
December 31, 2018 ($ thousands)
2017 Actual
$20,613
Year
2018
2019
Net sales
4.
Growth rate in net sales
25.0%
Cost of goods sold/net sales
Gen., sell., and admin. expenses/net sales
Long-term debt
Current portion long-term debt
9.
86.0%
6.
12.0%
2$
24
760
$660
100
$100
Interest rate
10.0%
10
11 Dividend/earnings after tax
Current assets/net sales
Tax rate
45.0%
50.0%
12
29.0%
13
14
Net fixed assets
$280
Current liabilities/net sales
14.5%
Owners' equity
16 INCOME STATEMENT
15
$1,730
17
Equations
2018
Forecast
Forecast
18
Year
2018
2019
19
Net sales
= B3 + B3*C4
$25,766
Cost of goods sold
Gross profit
20
= C5*C19
= C19 - C2O
22,159
21
3,607
22
Gen., sell., and admin. exp.
= C6*C19
= C9*(C7 + C8 + C40)
= C21 - C22- C23
= C10 C24
3,092
23
Interest expense
231
24 Earnings before tax
285
25
Tax
128
26 Earnings after tax
27 Dividends paid
= C24 - C25
156
= C11 C26
= C26 – C27
78
28
Additions to retained earnings
29
78
30
BALANCE SHEET
31 Current assets
= C12*C19
7,472
32
Net fixed assets
= C13
33
Total assets
280
= C31 + C32
34
7,752
Current liabilities
36 Long-term debt
Owners' equity
35
= C14*C19
= C7
= B15 + C28
= C35 + C36 + C37
3,736
37
660
38
39 equity
1,808
6,204
Total liabilities and owners'
40
EXTERNAL FUNDING REQUIRED
= C33 - C38
$ 1,548
Expert Solution
This question has been solved!
Explore an expertly crafted, step-by-step solution for a thorough understanding of key concepts.

This is a popular solution!

Trending now
This is a popular solution!

Step by step
Solved in 2 steps

Knowledge Booster


Learn more about
Need a deep-dive on the concept behind this application? Look no further. Learn more about this topic, finance and related others by exploring similar questions and additional content below.Recommended textbooks for you

Intermediate Financial Management (MindTap Course…
Finance
ISBN:
9781337395083
Author:
Eugene F. Brigham, Phillip R. Daves
Publisher:
Cengage Learning
Intermediate Financial Management (MindTap Course…
Finance
ISBN:
9781337395083
Author:
Eugene F. Brigham, Phillip R. Daves
Publisher:
Cengage Learning