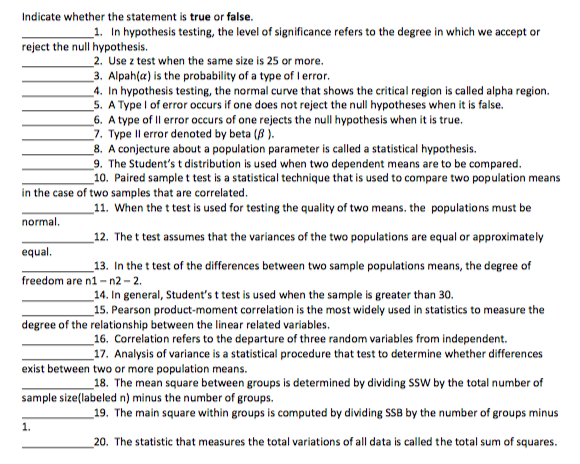
_1. In hypothesis testing, the level of significance refers to the degree in which we accept or reject the null hypothesis. _2. Use z test when the same size is 25 or more. 3. Alpah(a) is the probability of a type of lerror. _4. In hypothesis testing, the normal curve that shows the critical region is called alpha region. 5. A Type l of error occurs if one does not reject the null hypotheses when it is false. _6. A type of Il error occurs of one rejects the null hypothesis when it is true. _7. Type Il error denoted by beta (B ). 8. A conjecture about a population parameter is called a statistical hypothesis. _9. The Student's t distribution is used when two dependent means are to be compared. 10. Paired sample t test is a statistical technique that is used to compare two population means in the case of two samples that are correlated. _11. When the t test is used for testing the quality of two means. the populations must be normal. _12. The t test assumes that the variances of the two populations are equal or approximately equal. _13. In the t test of the differences between two sample populations means, the degree of freedom are n1 - n2– 2. _14. In general, Student's t test is used when the sample is greater than 30. _15. Pearson product-moment correlation is the most widely used in statistics to measure the degree of the relationship between the linear related variables. _16. Correlation refers to the departure of three random variables from independent. 17. Analysis of variance is a statistical procedure that test to determine whether differences exist between two or more population means. _18. The mean square between groups is determined by dividing SSw by the total number of sample size(labeled n) minus the number of groups. _19. The main square within groups is computed by dividing SSB by the number of groups minus 1. _20. The statistic that measures the total variations of all data is called the total sum of squares.


Family of Curves
A family of curves is a group of curves that are each described by a parametrization in which one or more variables are parameters. In general, the parameters have more complexity on the assembly of the curve than an ordinary linear transformation. These families appear commonly in the solution of differential equations. When a constant of integration is added, it is normally modified algebraically until it no longer replicates a plain linear transformation. The order of a differential equation depends on how many uncertain variables appear in the corresponding curve. The order of the differential equation acquired is two if two unknown variables exist in an equation belonging to this family.
XZ Plane
In order to understand XZ plane, it's helpful to understand two-dimensional and three-dimensional spaces. To plot a point on a plane, two numbers are needed, and these two numbers in the plane can be represented as an ordered pair (a,b) where a and b are real numbers and a is the horizontal coordinate and b is the vertical coordinate. This type of plane is called two-dimensional and it contains two perpendicular axes, the horizontal axis, and the vertical axis.
Euclidean Geometry
Geometry is the branch of mathematics that deals with flat surfaces like lines, angles, points, two-dimensional figures, etc. In Euclidean geometry, one studies the geometrical shapes that rely on different theorems and axioms. This (pure mathematics) geometry was introduced by the Greek mathematician Euclid, and that is why it is called Euclidean geometry. Euclid explained this in his book named 'elements'. Euclid's method in Euclidean geometry involves handling a small group of innately captivate axioms and incorporating many of these other propositions. The elements written by Euclid are the fundamentals for the study of geometry from a modern mathematical perspective. Elements comprise Euclidean theories, postulates, axioms, construction, and mathematical proofs of propositions.
Lines and Angles
In a two-dimensional plane, a line is simply a figure that joins two points. Usually, lines are used for presenting objects that are straight in shape and have minimal depth or width.
NO NEED FOR AN EXPLANATION. IF YOU CAN'T FOLLOW INSTRUCTIONS THEN DON'T ANSWER. JUST TRUE OR FALSE SO EVERYTHING CAN GET ANSWERED. I KNOW YOUR Q&A GUIDLINES ONLY ALLOW YOU TO ANSWER 3 WITH SOLUTION, BUT I'M NOT ASKING FOR A SOLUTION. ONLY TRUE OR FALSE


Trending now
This is a popular solution!

Step by step
Solved in 2 steps with 2 images


