(a) Apply the moving average (MA) model with a three-day lag (q = 3) and a five-day lag (q =5) to forecast Apple Inc.'s stock price in the following three trading days (i.e., its stock price on November 19, 20 and 21). (Hint: calculate the stock price on November 19 first, and then use the estimated stock price of November 19 to forecast the stock price on November 20.) (ROUND TO ONE DECIMAL)
(a) Apply the moving average (MA) model with a three-day lag (q = 3) and a five-day lag (q =5) to forecast Apple Inc.'s stock price in the following three trading days (i.e., its stock price on November 19, 20 and 21). (Hint: calculate the stock price on November 19 first, and then use the estimated stock price of November 19 to forecast the stock price on November 20.) (ROUND TO ONE DECIMAL)
Practical Management Science
6th Edition
ISBN:9781337406659
Author:WINSTON, Wayne L.
Publisher:WINSTON, Wayne L.
Chapter7: Nonlinear Optimization Models
Section7.6: Models For Rating Sports Teams
Problem 28P
Related questions
Question
Both correlate to the problem in the 1st photo

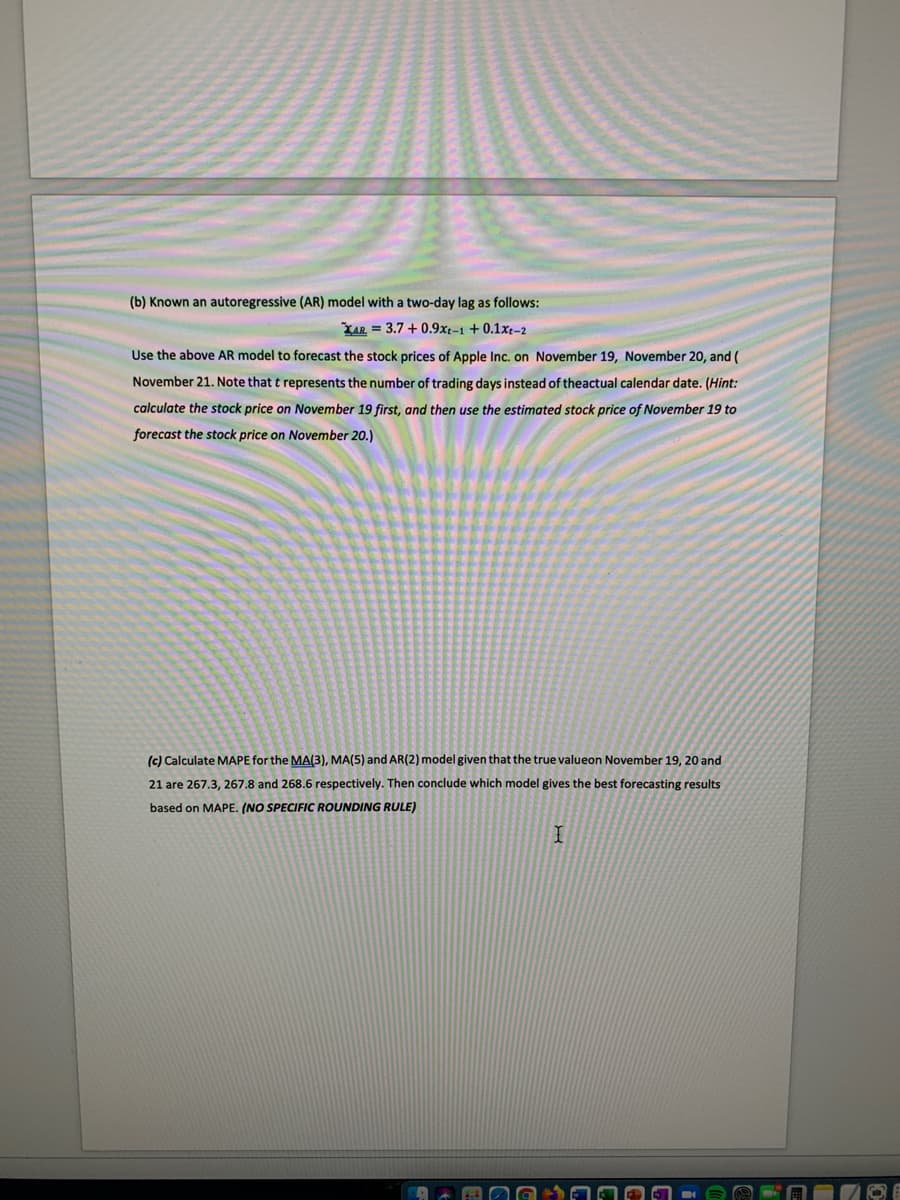
Transcribed Image Text:(b) Known an autoregressive (AR) model with a two-day lag as follows:
XAR = 3.7 + 0.9xt-1 +0.1xt-2
Use the above AR model to forecast the stock prices of Apple Inc. on November 19, November 20, and (
November 21. Note that t represents the number of trading days instead of theactual calendar date. (Hint:
calculate the stock price on November 19 first, and then use the estimated stock price of November 19 to
forecast the stock price on November 20.)
(c) Calculate MAPE for the MA(3), MA(5) and AR(2) model given that the true valueon November 19, 20 and
21 are 267.3, 267.8 and 268.6 respectively. Then conclude which model gives the best forecasting results
based on MAPE. (NO SPECIFIC ROUNDING RULE)

Transcribed Image Text:A Problem Set 3-edited – Saved to my Mac
Review
View
O Tell me
处T
AaBbCcD
AaBbCcDdE AABE
AaBbCcDdEe
AaBbCcDdEe
AaBbCcDdEe
AaBbCcDdEe
AaBbCcDdEe
List Paragraph
Heading 1
Heading 2
Ti
Normal
Body Text
No Spacing
Table Paragr..
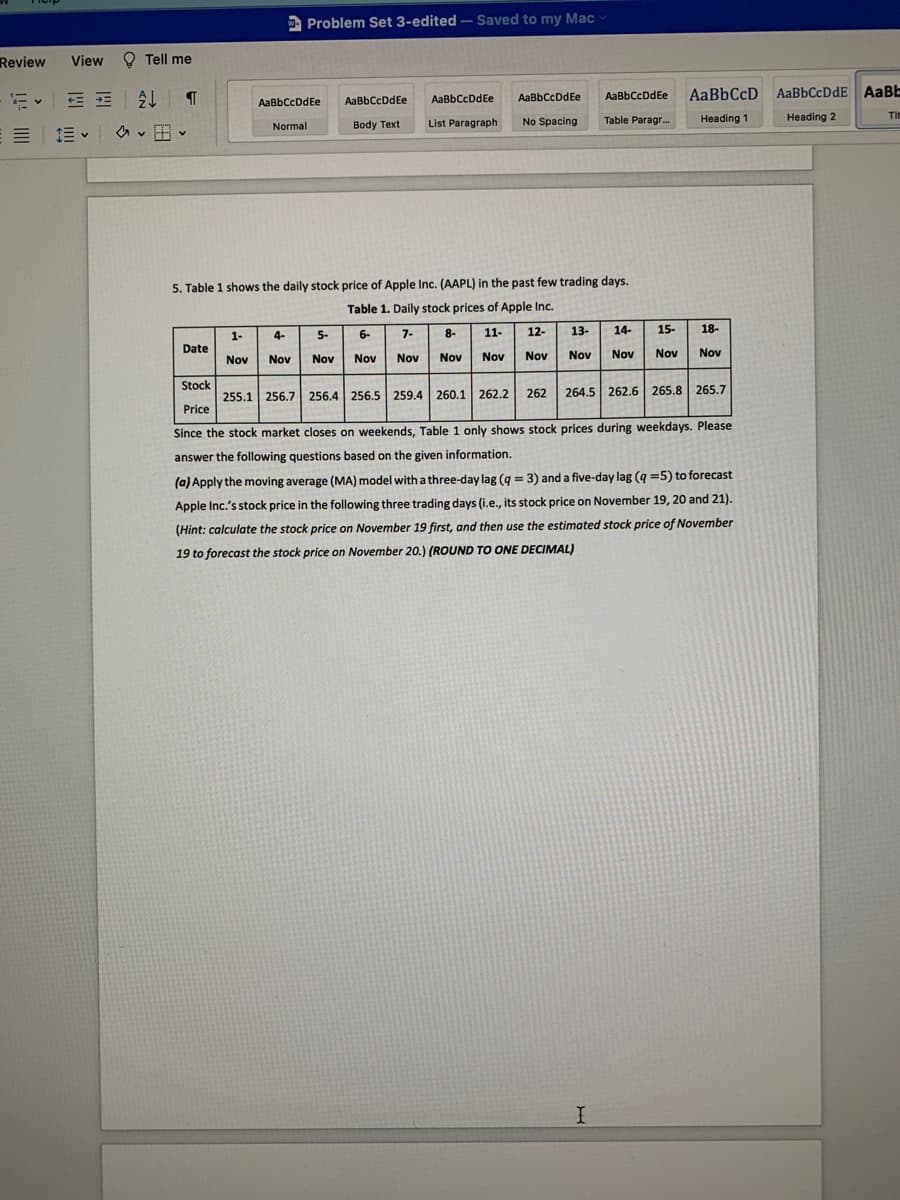
5. Table 1 shows the daily stock price of Apple Inc. (AAPL) in the past few trading days.
Table 1. Daily stock prices of Apple Ic.
1-
4-
5-
6-
7-
8-
11-
12-
13-
14-
15-
18-
Date
Nov
Nov
Nov
Nov
Nov
Nov
Nov
Nov
Nov
Nov
Nov
Nov
Stock
255.1 256.7 256.4 256.5 259.4 260.1 262.2
262
264.5 262.6 265.8 265.7
Price
Since the stock market closes on weekends, Table 1 only shows stock prices during weekdays. Please
answer the following questions based on the given information.
(a) Apply the moving average (MA) model with a three-day lag (g = 3) and a five-day lag (q =5) to forecast
%3D
Apple Inc.'s stock price in the following three trading days (i.e., its stock price on November 19, 20 and 21).
(Hint: calculate the stock price on November 19 first, and then use the estimated stock price of November
19 to forecast the stock price on November 20.) (ROUND TO ONE DECIMAL)
Expert Solution
This question has been solved!
Explore an expertly crafted, step-by-step solution for a thorough understanding of key concepts.
This is a popular solution!
Trending now
This is a popular solution!
Step by step
Solved in 5 steps with 6 images

Recommended textbooks for you

Practical Management Science
Operations Management
ISBN:
9781337406659
Author:
WINSTON, Wayne L.
Publisher:
Cengage,

Practical Management Science
Operations Management
ISBN:
9781337406659
Author:
WINSTON, Wayne L.
Publisher:
Cengage,