Week Of Pints Used August 31 September 7 September 14 September 21 September 28 October 5 345 370 410 378 368 371 ) The forecasted demand for the week of October 12 using a 3-week moving average = 372.33 pints (round your response to two decimal places). ) Using a 3-week weighted moving average, with weights of 0.15, 0.30, and 0.55, using 0.55 for the most recent week, the forecasted demand for the week of October 12 = 371.15 pints (round your esponse to two decimal places and remember to use the weights in appropriate order- the largest weight applies to most recent period and smallest weight applies to oldest period.) If the forecasted demand for the week of August 31 is 345 and a = 0.25, using exponential smoothing, develop the forecast for each of the weeks with the known demand and the forecast for the week f October 12 (round your responses to two decimal places). Forecast for this Date Week Of Pints Used August 31 345 345 September 7 September 14 370 345.00 410 351.25 September 21 378
Week Of Pints Used August 31 September 7 September 14 September 21 September 28 October 5 345 370 410 378 368 371 ) The forecasted demand for the week of October 12 using a 3-week moving average = 372.33 pints (round your response to two decimal places). ) Using a 3-week weighted moving average, with weights of 0.15, 0.30, and 0.55, using 0.55 for the most recent week, the forecasted demand for the week of October 12 = 371.15 pints (round your esponse to two decimal places and remember to use the weights in appropriate order- the largest weight applies to most recent period and smallest weight applies to oldest period.) If the forecasted demand for the week of August 31 is 345 and a = 0.25, using exponential smoothing, develop the forecast for each of the weeks with the known demand and the forecast for the week f October 12 (round your responses to two decimal places). Forecast for this Date Week Of Pints Used August 31 345 345 September 7 September 14 370 345.00 410 351.25 September 21 378

Practical Management Science
6th Edition
ISBN:9781337406659
Author:WINSTON, Wayne L.
Publisher:WINSTON, Wayne L.
Chapter13: Regression And Forecasting Models
Section13.7: Exponential Smoothing Models
Problem 29P: The file P13_29.xlsx contains monthly time series data for total U.S. retail sales of building...

Related questions

Question
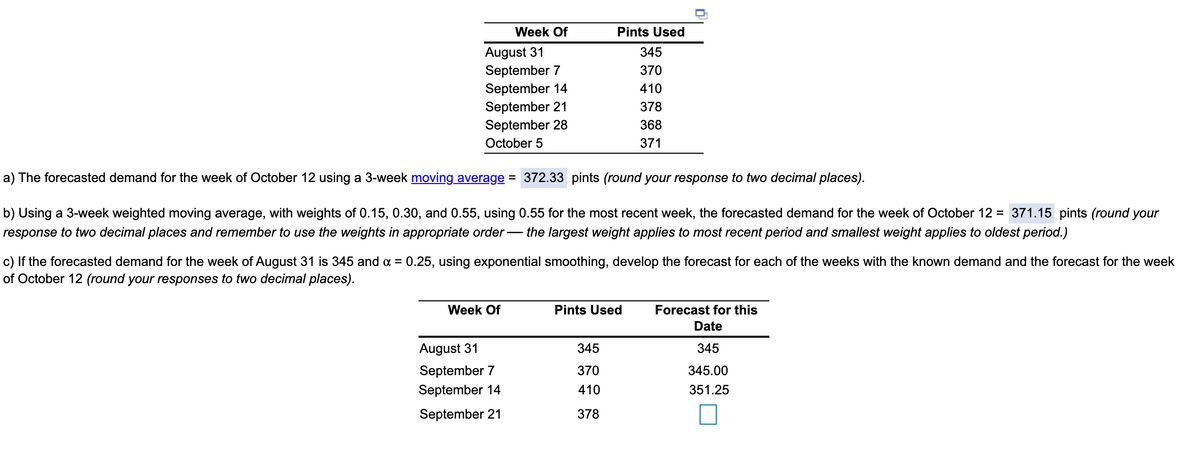
Transcribed Image Text:Week Of
Pints Used
August 31
September 7
September 14
September 21
September 28
345
370
410
378
368
October 5
371
a) The forecasted demand for the week of October 12 using a 3-week moving average = 372.33 pints (round your response to two decimal places).
b) Using a 3-week weighted moving average, with weights of 0.15, 0.30, and 0.55, using 0.55 for the most recent week, the forecasted demand for the week of October 12 = 371.15 pints (round your
response to two decimal places and remember to use the weights in appropriate order– the largest weight applies to most recent period and smallest weight applies to oldest period.)
c) If the forecasted demand for the week of August 31 is 345 and a = 0.25, using exponential smoothing, develop the forecast for each of the weeks with the known demand and the forecast for the week
of October 12 (round your responses to two decimal places).
Week Of
Pints Used
Forecast for this
Date
August 31
345
345
September 7
370
345.00
September 14
410
351.25
September 21
378
Expert Solution
This question has been solved!
Explore an expertly crafted, step-by-step solution for a thorough understanding of key concepts.

This is a popular solution!

Trending now
This is a popular solution!

Step by step
Solved in 3 steps with 2 images

Knowledge Booster


Learn more about
Need a deep-dive on the concept behind this application? Look no further. Learn more about this topic, operations-management and related others by exploring similar questions and additional content below.Recommended textbooks for you
Practical Management Science
Operations Management
ISBN:
9781337406659
Author:
WINSTON, Wayne L.
Publisher:
Cengage,

Contemporary Marketing
Marketing
ISBN:
9780357033777
Author:
Louis E. Boone, David L. Kurtz
Publisher:
Cengage Learning

Marketing
Marketing
ISBN:
9780357033791
Author:
Pride, William M
Publisher:
South Western Educational Publishing
Practical Management Science
Operations Management
ISBN:
9781337406659
Author:
WINSTON, Wayne L.
Publisher:
Cengage,
Contemporary Marketing
Marketing
ISBN:
9780357033777
Author:
Louis E. Boone, David L. Kurtz
Publisher:
Cengage Learning
Marketing
Marketing
ISBN:
9780357033791
Author:
Pride, William M
Publisher:
South Western Educational Publishing