(a) Approximately 95% of the company's rides have fares between $ and $O. (b) Approximately ? v of the company's rides have fares between $28.90 and $37.10.
(a) Approximately 95% of the company's rides have fares between $ and $O. (b) Approximately ? v of the company's rides have fares between $28.90 and $37.10.

Glencoe Algebra 1, Student Edition, 9780079039897, 0079039898, 2018
18th Edition
ISBN:9780079039897
Author:Carter
Publisher:Carter
Chapter10: Statistics
Section10.4: Distributions Of Data
Problem 19PFA

Related questions
Question
100%
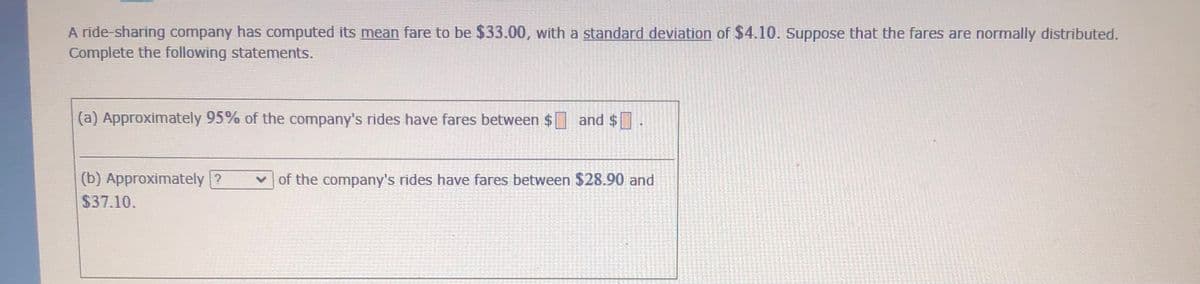
Transcribed Image Text:A ride-sharing company has computed its mean fare to be $33.00, with a standard deviation of $4.10. Suppose that the fares are normally distributed.
Complete the following statements.
(a) Approximately 95% of the company's rides have fares between $ and $.
(b) Approximately ?
of the company's rides have fares between $28.90 and
$37.10.
Expert Solution
This question has been solved!
Explore an expertly crafted, step-by-step solution for a thorough understanding of key concepts.

Step by step
Solved in 2 steps with 2 images

Recommended textbooks for you
Glencoe Algebra 1, Student Edition, 9780079039897…
Algebra
ISBN:
9780079039897
Author:
Carter
Publisher:
McGraw Hill
Glencoe Algebra 1, Student Edition, 9780079039897…
Algebra
ISBN:
9780079039897
Author:
Carter
Publisher:
McGraw Hill