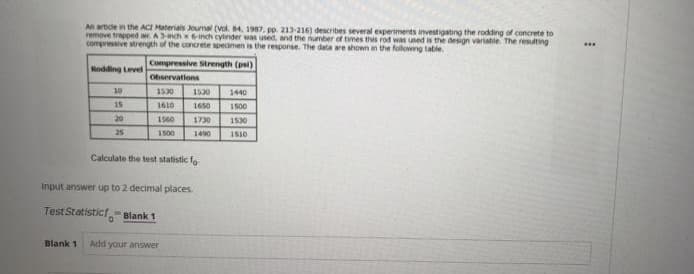
A artide in the ACI Materials Joumal (vol. 4, 1987. pp. 213-216) describes several experiments investigating the rodding of concrete to remove trapped ar. Anch6inch cylinder was used, and the number of times this rod was used is the design variable. The resulting compresve strength of the concrete specimen is the response. The data are shown n the followng table. Compressive Strength (psi) Rodding Level Observations 10 1530 1530 1440 15 1610 1650 1500 20 1560 1730 1530 25 1500 1490 1S10 Calculate the test statistic fo Input answer up to 2 decimal places. TestStatistict Blank 1 Blank 1 Add your answer


Q: Assume that adults have IQ scores that are normally distributed with a mean of 100 and a standard…
A: Given that. X~N( μ , ?^2 ) μ=100 , ?=15 Z-score =( x - μ )/?
Q: On an intelligence test, the mean number of raw items correct is 235 and the standard deviation is…
A:
Q: Future scientists: Education professionals refer to science, technology, engineering, and…
A: A research group reported that 26% of freshmen entering college in a recent year planned to major in…
Q: An article in the Journal of Sound and Vibration (Vol. 151, 1991, pp. 383-394) described a study…
A: For the given data Find slope =?
Q: SHOW COMPLETE SOLUTION The average number of field mice per acre in a 5-acre wheat field is…
A:
Q: reatment I II III 4 4 9 N = 12 G = 48 ∑X2 = 260 2 0 3 6 3 6 4 1 6 M = 4 T =…
A: Use the Excel And Perform the One way anova Followings are the steps to perform the One way anova…
Q: A new lie-detector test has been devised and must be tested before it is put into use. Two hundred…
A: See below
Q: Identify the type of sampling that is used in this statement. To avoid working late, a quality…
A: Sampling is integral to inferential statistical analysis.
Q: Q4) A factory manufactures cups. The manager knows from past experience that 5% of the cups produced…
A: Let X be the random variable from binomial distribution with probability (p) = 5% or 0.05 and sample…
Q: From the data we find that Sxx = 0.11273, Syy = 11,807,324,805, Sxy = 34,422.28. n=29, test the null…
A: The question is based on testing of correlation coefficient Given : Significance level ( α ) = 0.05…
Q: A artide n the ACI Materials Joumal (vol. 4, 1987, po. 213-216) describes se remove trapped ar…
A: Rodding level Compressive strength observation 10 1530 1530 1440 15 1610 1650 1500 20 1560…
Q: Example 6.3.1: A company pays an average of $9 per hour. A sample of 21 workers shows mean wage of…
A:
Q: A psychologist is interested in constructing a 99% confidence interval for the proportion of people…
A: Solution-: Given: n=705,X=56,α=0.01 We want to find, (a) With 99% confidence the proportion of all…
Q: An article in the Journal of Agricultural Engineering Research (Vol. 52, 1992, pp. 53-76) describes…
A: Given data
Q: An article in the Journal of Agricultural Engineering Research (Vol. 52, 1992, pp. 53-76) describes…
A:
Q: TRUE OR FALSE> It is possible for the chi-square value to be zero
A: Solution
Q: Problem 2.1: The probability distribution for the discrete random variable X is described in the…
A:
Q: Assume that a sample is used to estimate a population proportion p. Find the 99% confidence interval…
A:
Q: what kind of samples are being described? Sample 1: Resting heart rates of 40 individuals before…
A: Given: Sample 1: Resting heart rates of 40 individuals before smoking. Sample 2: Resting heart rates…
Q: Suppose X1 and X2 are iid observations from the pdf f(r|a) = ax 0. Show that (log X1)/(log X2) is an…
A:
Q: A test has 10 multiple choice questions, and each question has 5 possible answers. How many answers…
A: Given: Number of questions, n=10 Each question has 5 possible answers.
Q: Research shows that exam performance is shown to initially increase with stress level and then at…
A: Association between two variables can be linear or non linear.
Q: (3) The beta parameter is the slope of the line between the predictor and outcome variables.
A: Given: Beta parameter is the slop of line between the predictor and outcome variables : True :…
Q: (b) Give a point estimate of a. (Round your answer to five decimal places.) Interpret this estimate.…
A: here as per guidelines i have calculated 3 subparts plz repost with note i need this this... here…
Q: Example 21.8) A marketing manager has to decide be- tween advertising his product on a national…
A:
Q: Given: n = 24 %3D x = 12 H,: μ = 10.5 s = 3.8 H4: μ + 10.5 μ- 10.5
A: As per company guidelines I solved exactly three subparts of the question.thank you
Q: Babies and younger boys are more likely to be diagnosed with peanut allergies. To test this claim a…
A:
Q: What is the null and alternative hypothesis? b. Fill in the contingency table. Include row & column…
A: Since you have posted a question with multiple sub-parts, we will solve first three subparts for…
Q: Compute the following. 8C3=
A:
Q: Many have cited fear of allergic reaction as a rational for not obtaining the COVID-19 vaccination.…
A:
Q: You are interested in estimating the the mean weight of the local adult population of female…
A:
Q: (a) For these 24 students, as the number of hours increases, the amount of money spent tends to…
A: From the above diagram, the answer can be given as, (a) For these 24 students, as the number of…
Q: The accompanying table shows the numbers of male and female students in a particular country who…
A: According to the given information, we have Total number of persons = 1832719
Q: An investigator polls a representative sample of common cold sufferers, asking them to estimate the…
A:
Q: If a significance test gives p-value 0.005... A.. the effect of interest is practically…
A:
Q: erform the given instructions below. Show the detailed computations for the numerical measures. 1.…
A: Given that, Ages of all the employees of a small company. 28 34 40 42 46 29 36 41 44 47 32 35…
Q: An article in the ACI Materials Journal (Vol. 84, 1987, pp. 213-216) describes several experiments…
A:
Q: A new cataracts removal procedure for persons older than 60 years of age with degrading vision from…
A: "Since you have posted a question with multiple subparts, we will solve first 3 sub-parts for you.…
Q: Kim has a strong first serve; whenever it is good (that is, in) she wins the point 85% of the…
A: Given wins the point 85% of the time.Whenever her second serve is good, she wins the point 40% of…
Q: An article in the Journal of the American Ceramic Society, "Rapid Hot-Pressing of Ultrafine PSZ…
A: For the given data Intercept = ?
Q: 2. Suppose the hospital buys 75 new intravenous (IV) pumps to be distributed among the five units on…
A:
Q: Use the given data to find the minimum sample size required to estimate the population proportion.…
A:
Q: Q2- The following table includes the grades of students who took Math during Fall. 40 55 50 55 28 60…
A: The data is 40,55,50,55,28,60,25,55,60,65,70,64,62,70,50,65,55,48,69,25,64,58,55,71
Q: An economist wants to find out if there is difference in the monthly expenses of families from…
A: Using t distribution
Q: What proportion of area of a normal curve is included between (i) o, (ii) 2 o and (iii) 3 o distance…
A:
Q: Instructions: I would like to know the average year of U.S. pennies in circulation. For this…
A: For 50- 150 pennies I will collect the following: I decided to choose the minimum value of 50…
Q: Express the confidence interval 0.882±0.0760.882±0.076 in open interval form (i.e., (0.155,0.855)).
A: We have given that 0.882±0.0760
Q: Two samples of video gamers have the following high sçores for their favorite video game. Calculate…
A:
Q: Cody took his first physics exam and scored an 80. The population mean for this exam is 70, and the…
A: The population mean for the exam is 70 and standard deviation is 5 μ=70σ=5 Cody's exam score is 80
Q: You measure 40 textbooks' weights, and find they have a mean weight of 59 ounce standard deviation…
A:

Step by step
Solved in 2 steps with 2 images

- The spike stature of the plants grown from the seeds of the porcine separates (Dactylis glomerata L) collected from the University campus and İbradı Eynif pasture are given below. In this plant, compare whether there is a difference between regions in terms of spike height. Virgo Height (cm) Data obtained from plants collected from university campus 5 6 8 7 8 6 5 5 4 6 6 Data obtained from plants collected from Eynif pasture 12 9 11 9 9 11 9 10 11 10 Note: Your results interpretation according to two different possibilities (Do it separately, assuming that it is 0.07 and 0.04).The article “Hydrogeochemical Characteristics of Groundwater in a Mid-Western CoastalAquifer System” (S. Jeen, J. Kim, et al., Geosciences Journal, 2001:339–348) presentsmeasurements of various properties of shallow groundwater in a certain aquifer system inKorea. Following are measurements of electrical conductivity (in microsiemens percentimeter) for 23 water samples.2099 528 2030 1350 1018 384 14991265 375 424 789 810 522 513488 200 215 486 257 557 260461 500Find the mean.Find the standard deviation.Find the median.Construct a dotplot.Find the 10% trimmed mean.Find the first quartile.Find the third quartile.Find the interquartile range.Construct a boxplot.Which of the points, if any, are outliers?If a histogram were constructed, would it be skewed to the left, skewed to the right, orapproximately symmetric?Lactation promotes a temporary loss of bone mass to provide adequate amounts of calcium for milk production. The paper “Bone Mass Is Recovered from Lactation to Postweaning in Adolescent Mothers with Low Calcium Intakes” (Amer. J. of Clinical Nutr., 2004: 1322–1326) gave the following data on total body bone mineral content (TBBMC) (g) for a sample both during lactation (L) and in the postweaning period (P). SubjectL 1928 2549 2825 1924 1628 2175 2114 2621 1843 2541P 2126 2885 2895 1942 1750 2184 2164 2626 2006 2627 Does the data suggest that true average total body bone mineral content during postweaning exceeds that during lactation by more than 25 g? State and test the appropriate hypotheses using a significance level of .05.
- The article “Effect of Varying Solids Concentration and Organic Loading on the Performance of Temperature Phased Anaerobic Digestion Process” (S. Vandenburgh and T. Ellis, Water Environment Research, 2002:142–148) discusses experiments to determine the effect of the solids concentration on the performance of treatment methods for wastewater sludge. In the first experiment, the concentration of solids (in g/L) was 43.94 ± 1.18. In the second experiment, which was independent of the first, the concentration was 48.66 ± 1.76. Estimate the difference in the concentration between the two experiments, and find the uncertainty in the estimate.rofessor Cornish studied rainfall cycles and sunspot cycles. (Reference: Australian Journal of Physics, Vol. 7, pp. 334-346.) Part of the data include amount of rain (in mm) for 6-day intervals. The following data give rain amounts for consecutive 6-day intervals at Adelaide, South Australia. 7 28 7 1 69 3 1 4 22 7 16 4 54 160 60 73 27 3 3 1 7 144 107 4 91 44 1 8 4 22 4 59 116 52 4 155 42 24 11 43 3 24 19 74 26 63 110 39 34 71 52 39 8 0 15 2 14 9 1 2 4 9 6 10 (i) Find the median. (Use 1 decimal place.)(ii) Convert this sequence of numbers to a sequence of symbols A and B, where A indicates a value above the median and B a value below the median. Test the sequence for randomness about the median at the 5% level of significance. (b) Find the number of runs R, n1, and n2. Let n1 = number of values above the median and n2 = number of values below the median. R n1 n2 (c) In the case, n1 > 20, we cannot use Table 10 of Appendix II to find the critical…An experiment to determine the effect of four different types of engine oil (A, B, C, and D) on the rolling friction coefficient of a car speed has been conducted. Three brands of car (Honda, Toyota, and Mazda) were chosen, and each engine oil was tested twice on each car, producing the following ANOVA output in Figure 2. i) How many treatments involved? Write down all the treatments ii) Identify the number of replication for each treatment. iii) Based on the ANOVA table above, find the values of W, X, Y and Z. iv) Test the interaction effect on rolling friction coefficient of car speed between the four different types of engine oil and the three different brands of car. v) Do we need to test for marginal effect? Give a reason.
- Stressed-Out Bus Drivers. Previous studies have shown that urban bus drivers have an extremely stressful job, and a large proportion of drivers retire prematurely with disabilities due to occupational stress. In the paper, “Hassles on the Job: A Study of a Job Intervention With Urban Bus Drivers” (Journal of Organizational Behavior, Vol. 20, pp. 199–208), G. Evans et al. examined the effects of an intervention program to improve the conditions of urban bus drivers.Amongother variables, the researchers monitored diastolic blood pressure of bus drivers in downtown Stockholm, Sweden. The data, in millimeters of mercury (mm Hg), on the WeissStats site are based on the blood pressures obtained prior to intervention for the 41 bus drivers in the study. Use the technology of your choice to do the following. a. Obtain a normal probability plot, boxplot, histogram, and stemand-leaf diagram of the data. b. Based on your results from part (a), can you reasonably apply the one-mean t-test to the…Q1 A) List down the measures of central tendency and measures of dispersion 2) The operations manager of a plant that manufactures tires wants to compare the actual inner diameters of two grades of tires, each of B) which is expected to be 575 millimeters. A sample of five tires of each grade was selected, and the results representing the inner diameters of the tires, ranked from smallest to largest, are as follows. Grade X grade Y 568 570 575 578 584 573 574 575 577 578 requirement. a) for each of the tow grades of tries, compute the mwan, median, and standred deviation. b) which grade of tire providing better quality? explain. c) what would be the effect on your answer in (a) and (b) if the last value for grade Y were 588 insert 578 explain. C) The file contins the overall miles per gallon (MPG) OF 2010 family sedan: 24 21 22 23 24 34 34 34 20 20 22 22 44 32 20 20 22 20 39 20 Source:…A paper investigated the driving behavior of teenagers by observing their vehicles as they left a high school parking lot and then again at a site approximately 1 2 mile from the school. Assume that it is reasonable to regard the teen drivers in this study as representative of the population of teen drivers. Amount by Which Speed Limit Was Exceeded MaleDriver FemaleDriver 1.3 -0.1 1.3 0.4 0.9 1.1 2.1 0.7 0.7 1.1 1.3 1.2 3 0.1 1.3 0.9 0.6 0.5 2.1 0.5 (a) Use a .01 level of significance for any hypothesis tests. Data consistent with summary quantities appearing in the paper are given in the table. The measurements represent the difference between the observed vehicle speed and the posted speed limit (in miles per hour) for a sample of male teenage drivers and a sample of female teenage drivers. (Use μmales − μfemales.Round your test statistic to two decimal places. Round your degrees of freedom down to the nearest whole number. Round your p-value to…
- A paper investigated the driving behavior of teenagers by observing their vehicles as they left a high school parking lot and then again at a site approximately 1 2 mile from the school. Assume that it is reasonable to regard the teen drivers in this study as representative of the population of teen drivers. Amount by Which Speed Limit Was Exceeded MaleDriver FemaleDriver 1.2 -0.1 1.4 0.4 0.9 1.1 2.1 0.7 0.7 1.1 1.3 1.2 3 0.1 1.3 0.9 0.6 0.5 2.1 0.5 (a) Use a .01 level of significance for any hypothesis tests. Data consistent with summary quantities appearing in the paper are given in the table. The measurements represent the difference between the observed vehicle speed and the posted speed limit (in miles per hour) for a sample of male teenage drivers and a sample of female teenage drivers. (Use μmales − μfemales.Round your test statistic to two decimal places. Round your degrees of freedom down to the nearest whole number. Round your p-value to…The following table gives the number of parking tickets obtained in a semester and the GPAs of 77 randomly selected drivers. Number of Tickets 0 1 2 3 4 7 8 GPA 5.5 5 4.5 4 3 2 1.5 Copy Data Determine if r is statistically significant at the 0.010.01 level. Yes or no?An article in the Journal of Applied Polymer Science (Vol. 56, pp. 471–476, 1995) studied the effect of the mole ratio of sebacic acid on the intrinsic viscosity of copolyesters.- The data follows: Viscosity 0.45 0.2 0.34 0.58 0.7 0.57 0.55 0.44 Mole ratio 1 0.9 0.8 0.7 0.6 0.5 0.4 0.3 (a) Construct a scatter diagram of the data.