A bank has 2 lines of phone service. When you call the number 444 on your phone system automatically redirects you to one of these 2 phone services. We want to test the average time of talking per custom


A bank has 2 lines of phone service. When you call the number 444 on your phone system automatically redirects you to one of these 2 phone services. We want to test the average time of talking per customer on line A and on line B and see if theres difference. We choose random samples and we get these numbers:
n1 = 200 n2 = 275
average time in seconds for 216 and 195
sample std deviation 35.10 37. 80
- a) using the samples Show the difference of N by %95 confidince interval
- b) create a hypothesis that talking time is longer in A than B then use hypotheses test with %7 importance level.
thanks
(a). Obtain the 95% confidence interval for the difference in mean talking time on line A and line B:
Denote µ1 as the population mean talking time on line A and µ2 as the population mean talking time on line B.
When the population standard deviations are unknown an independent sample t-test is appropriate.
Assume that the population variances are equal.
Pooled sample variance:
The sample size of line A is n1 = 200.
The sample size of line B is n2 = 275.
The sample standard deviation of line A is s1 = 35.1,
The sample standard deviation of line B is s2 = 37.8.
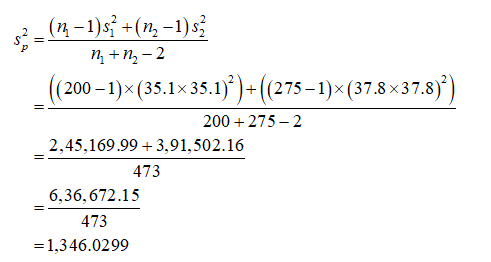
Thus, the pooled sample variance is 1,346.0299.
Standard error:
Standard error is obtained as given below:
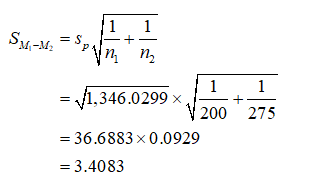
Thus, the standard error for the difference of means is 3.4083.
Critical value:
The required confidence level is 100*(1–α)% = 95%.
The critical value is obtained as 1.9650 from the calculation given below:
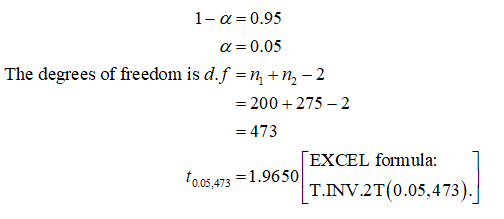
Thus, the critical value is 1.9650.
The sample mean talking time on line A is x1-bar = 216,
The sample mean talking time on line B is x2-bar = 195,
The 95% confidence interval for the difference in mean talking time on line A and line B is obtained as (14.3027 ≤ (µ1 - µ2) ≤ 27.6973) from the calculation given below:
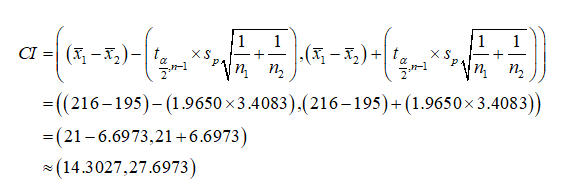
Thus, the 95% confidence interval for the difference in mean talking time on line A and line B is (14.3027 ≤ (µ1 - µ2) ≤ 27.6973).
The 95% confidence interval does not contain the value “0”. Therefore, there is no evidence to conclude that there is no significant difference between the mean talking time on line A and line B.
Hence, the 95% confidence interval infers a significant difference between the mean talking time on line A and line B.

Step by step
Solved in 2 steps with 6 images


