À baseball analyst would like to study various team statistics for a recent season to determine which variables might be useful in predicting the number of wins achieved by teams during the season. He begins by using a team's earned run average (ERA), a measure of pitching performance, to predict the number of wins. He collects the team ERA and team wins for each of the 30 teams in a two-league organization, with the accompanying results. Complete parts (a) through (1) below. Но H : (Type integers or decimals. Do not round.) Determine the test statistic. tSTAT = (Round to two decimal places as needed.) Determine the p-value. The p-value is. (Round to three decimal places as needed.) State the conclusion. Ho. There evidence of a linear relationship between the number of wins and the ERA. f. Construct a 95% confidence interval of the mean number of wins expected for teams with an ERA of 4.00. OSHYX = 4.00 O (Round to one decimal place as needed.) g. Construct a 95% confidence interval estimate of the population slope.
À baseball analyst would like to study various team statistics for a recent season to determine which variables might be useful in predicting the number of wins achieved by teams during the season. He begins by using a team's earned run average (ERA), a measure of pitching performance, to predict the number of wins. He collects the team ERA and team wins for each of the 30 teams in a two-league organization, with the accompanying results. Complete parts (a) through (1) below. Но H : (Type integers or decimals. Do not round.) Determine the test statistic. tSTAT = (Round to two decimal places as needed.) Determine the p-value. The p-value is. (Round to three decimal places as needed.) State the conclusion. Ho. There evidence of a linear relationship between the number of wins and the ERA. f. Construct a 95% confidence interval of the mean number of wins expected for teams with an ERA of 4.00. OSHYX = 4.00 O (Round to one decimal place as needed.) g. Construct a 95% confidence interval estimate of the population slope.

Glencoe Algebra 1, Student Edition, 9780079039897, 0079039898, 2018
18th Edition
ISBN:9780079039897
Author:Carter
Publisher:Carter
Chapter10: Statistics
Section10.6: Summarizing Categorical Data
Problem 13CYU

Related questions
Question
Need help answering please
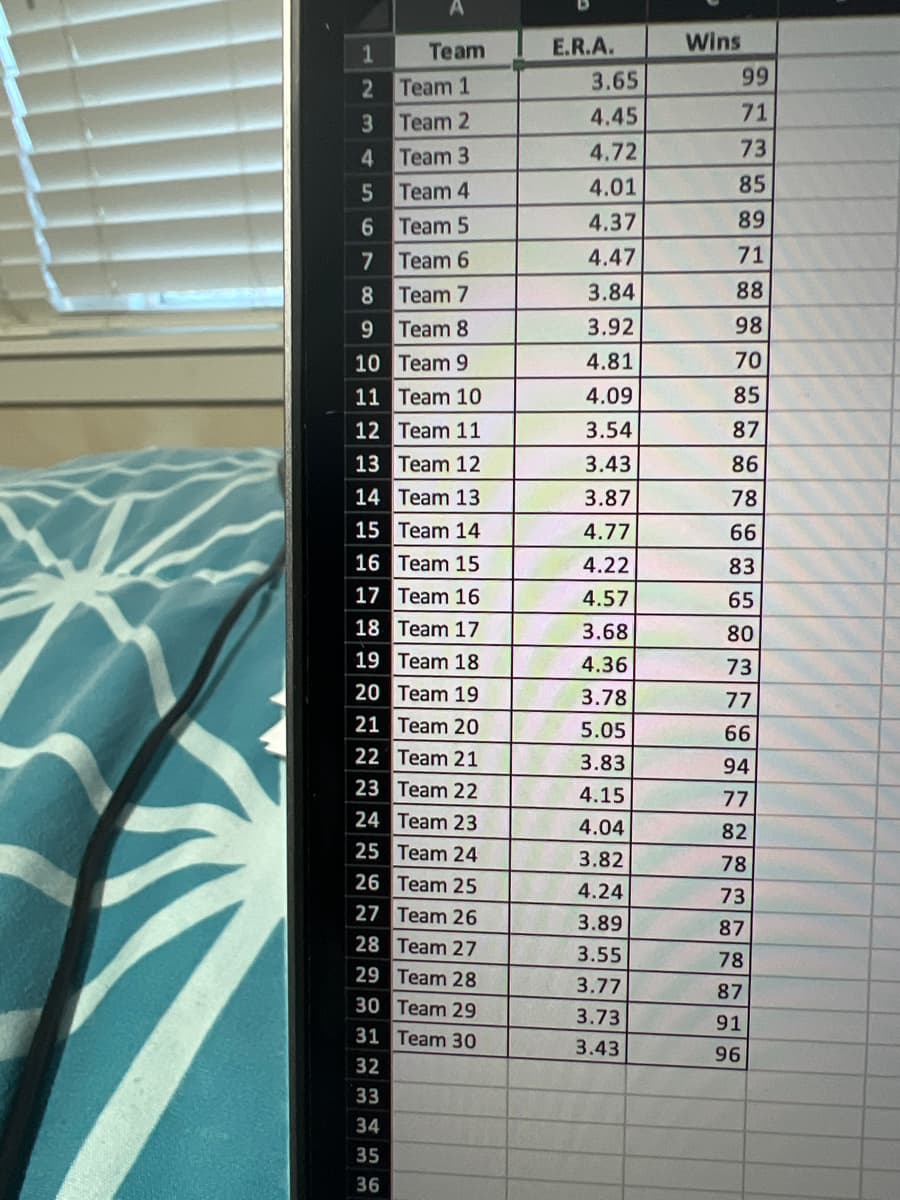
Transcribed Image Text:Team
E.R.A.
Wins
3.65
99
2 Team 1
3 Team 2
4 Team 3
5 Team 4
4.45
71
4.72
73
4.01
85
6 Team 5
4.37
89
7
Team 6
4.47
71
88
8 Team 7
9 Team 8
10 Team 9
3.84
3.92
98
4.81
70
11 Team 10
4.09
85
12 Team 11
3.54
87
13 Team 12
3.43
86
14 Team 13
3.87
78
15 Team 14
4.77
66
16 Team 15
4.22
83
17 Team 16
4.57
65
18 Team 17
3.68
80
19 Team 18
4.36
73
20 Team 19
3.78
77
21 Team 20
5.05
66
22 Team 21
3.83
94
23 Team 22
4.15
77
24 Team 23
4.04
82
25 Team 24
3.82
78
26 Team 25
4.24
73
27 Team 26
28 Team 27
3.89
87
3.55
78
29 Team 28
3.77
87
30 Team 29
3.73
91
31 Team 30
3.43
96
32
33
34
35
36
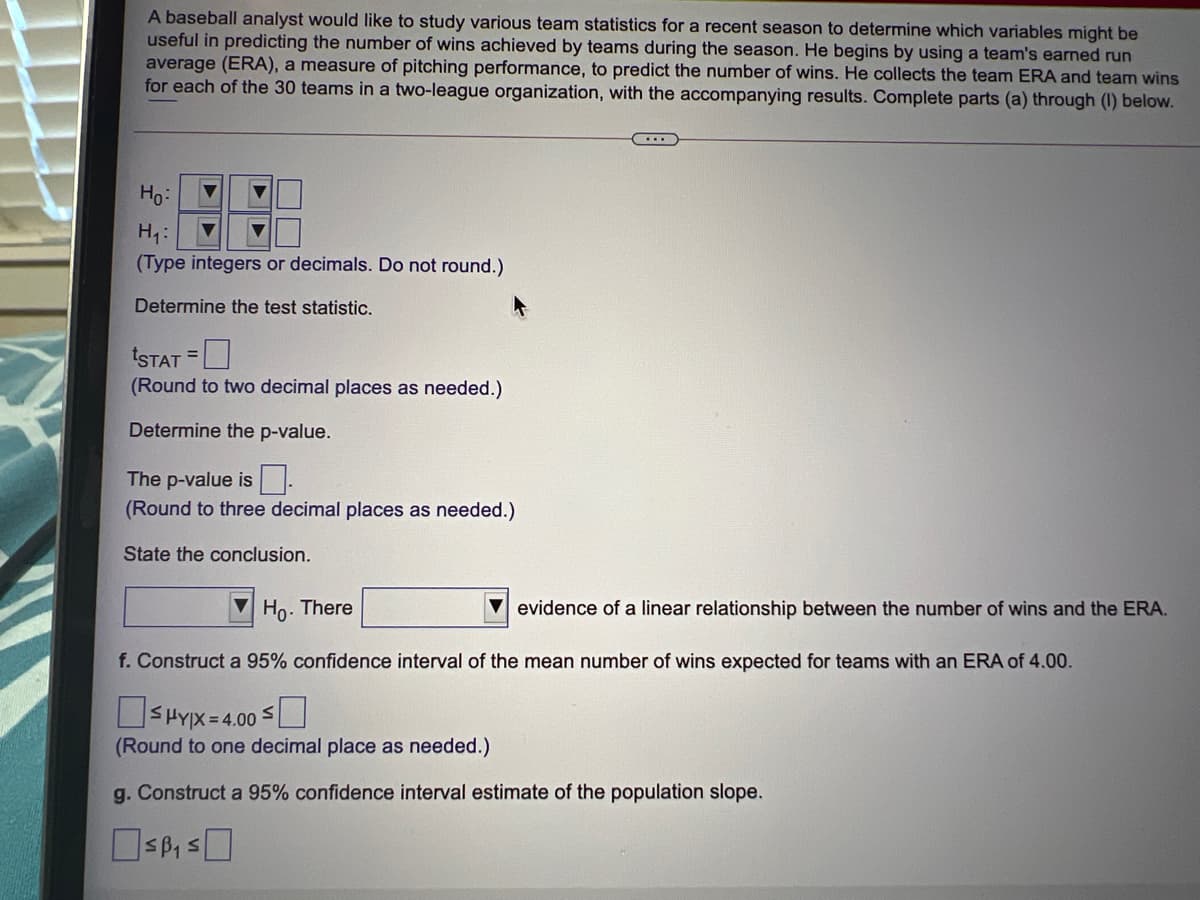
Transcribed Image Text:A baseball analyst would like to study various team statistics for a recent season to determine which variables might be
useful in predicting the number of wins achieved by teams during the season. He begins by using a team's earned run
average (ERA), a measure of pitching performance, to predict the number of wins. He collects the team ERA and team wins
for each of the 30 teams in a two-league organization, with the accompanying results. Complete parts (a) through (I) below.
Ho:
H1:
(Type integers or decimals. Do not round.)
Determine the test statistic.
tSTAT =
(Round to two decimal places as needed.)
Determine the p-value.
The p-value is:
(Round to three decimal places as needed.)
State the conclusion.
Ho. There
evidence of a linear relationship between the number of wins and the ERA.
f. Construct a 95% confidence interval of the mean number of wins expected for teams with an ERA of 4.00.
OSHYX =4.00 S
O
(Round to one decimal place as needed.)
g. Construct a 95% confidence interval estimate of the population slope.
Expert Solution
This question has been solved!
Explore an expertly crafted, step-by-step solution for a thorough understanding of key concepts.

This is a popular solution!

Trending now
This is a popular solution!

Step by step
Solved in 2 steps

Recommended textbooks for you
Glencoe Algebra 1, Student Edition, 9780079039897…
Algebra
ISBN:
9780079039897
Author:
Carter
Publisher:
McGraw Hill
Glencoe Algebra 1, Student Edition, 9780079039897…
Algebra
ISBN:
9780079039897
Author:
Carter
Publisher:
McGraw Hill