A C Inflation rate, π¹ Inflation Inflation 4.5 4 3.5 3 2.5 2 1 2 3 Select one or more: O Chart A Chart B Chart C Chart D 5 4 7 6 VPC 9 8 PC = n¹ MR 11 Output, Y B flation 4.5 3 U 2.5 2 4 13 15 17 19 12 14 16 18 20 4 10 Time period Figure 14 Policy response to a positive demand shock 3.5 2 3 5 7 9 11 13 15 17 19 6 8 10 12 14 16 18 20 D Inflation rate, n² Time period Figure 14 shows four charts labelled A to D depicting aspects of a positive permanent demand shock. Charts B and C are from the DD209 macrosimulator, while Charts A and D show MR curves. Which two of these charts are consistent with the policy response from a central bank that has a strong inflation aversion? (Choose two answers.) VPC MR PC = π¹ Output, Y
A C Inflation rate, π¹ Inflation Inflation 4.5 4 3.5 3 2.5 2 1 2 3 Select one or more: O Chart A Chart B Chart C Chart D 5 4 7 6 VPC 9 8 PC = n¹ MR 11 Output, Y B flation 4.5 3 U 2.5 2 4 13 15 17 19 12 14 16 18 20 4 10 Time period Figure 14 Policy response to a positive demand shock 3.5 2 3 5 7 9 11 13 15 17 19 6 8 10 12 14 16 18 20 D Inflation rate, n² Time period Figure 14 shows four charts labelled A to D depicting aspects of a positive permanent demand shock. Charts B and C are from the DD209 macrosimulator, while Charts A and D show MR curves. Which two of these charts are consistent with the policy response from a central bank that has a strong inflation aversion? (Choose two answers.) VPC MR PC = π¹ Output, Y

Principles of Economics 2e
2nd Edition
ISBN:9781947172364
Author:Steven A. Greenlaw; David Shapiro
Publisher:Steven A. Greenlaw; David Shapiro
Chapter22: Inflation
Section: Chapter Questions
Problem 23CTQ: Given the federal budget deficit in recent years, some economists have argued mat by adjusting...

Related questions
Question
Transcribed Image Text:A
C
Inflation
rate,
Inflation
Inflation
T
4.5
4
Chart D
3.5
3
2.5
2
1
2
Select one or more:
O Chart A
Chart B
Chart C
3
4
5
6
VPC
7
8
PC = π¹
9
MR
Output, Y
B
Inflation
Inflation
11
10
Time period
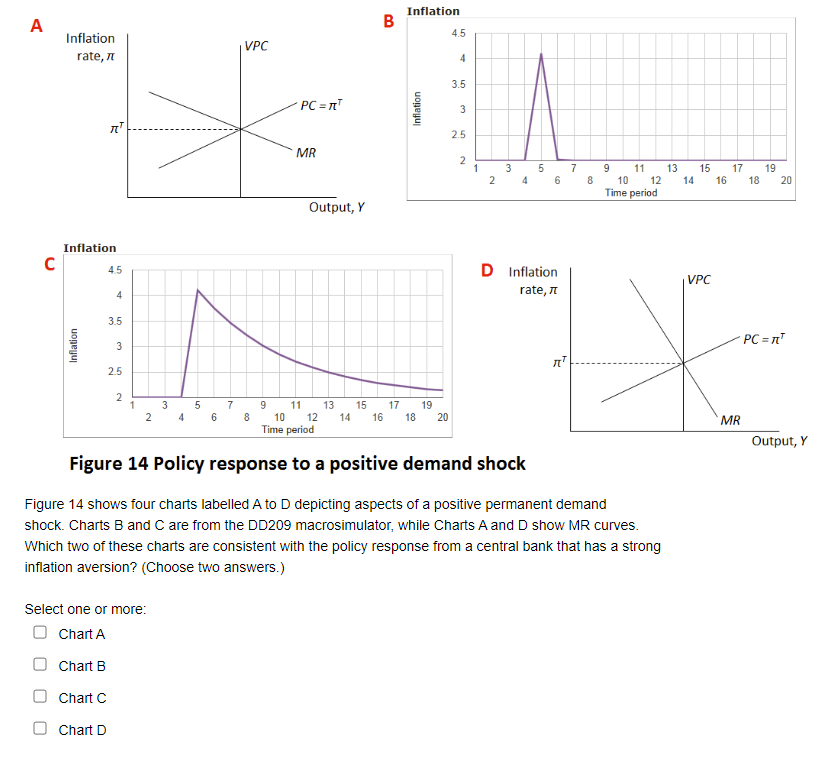
Figure 14 Policy response to a positive demand shock
13 15 17
12 14 16 18
19
4.5
20
4
3.5
3
2.5
2
2
3
19
4
5 7 9 11 13 15 17
8 10 12 14 16 18 20
Time period
6
D Inflation
VPC
76
rate,
Figure 14 shows four charts labelled A to D depicting aspects of a positive permanent demand
shock. Charts B and C are from the DD209 macrosimulator, while Charts A and D show MR curves.
Which two of these charts are consistent with the policy response from a central bank that has a strong
inflation aversion? (Choose two answers.)
MR
PC = n¹
Output, Y
Expert Solution
This question has been solved!
Explore an expertly crafted, step-by-step solution for a thorough understanding of key concepts.

Step by step
Solved in 5 steps with 2 images

Recommended textbooks for you
Principles of Economics 2e
Economics
ISBN:
9781947172364
Author:
Steven A. Greenlaw; David Shapiro
Publisher:
OpenStax

Exploring Economics
Economics
ISBN:
9781544336329
Author:
Robert L. Sexton
Publisher:
SAGE Publications, Inc

Principles of Economics 2e
Economics
ISBN:
9781947172364
Author:
Steven A. Greenlaw; David Shapiro
Publisher:
OpenStax
Exploring Economics
Economics
ISBN:
9781544336329
Author:
Robert L. Sexton
Publisher:
SAGE Publications, Inc

Economics (MindTap Course List)
Economics
ISBN:
9781337617383
Author:
Roger A. Arnold
Publisher:
Cengage Learning